

90
P. Kumar et al.
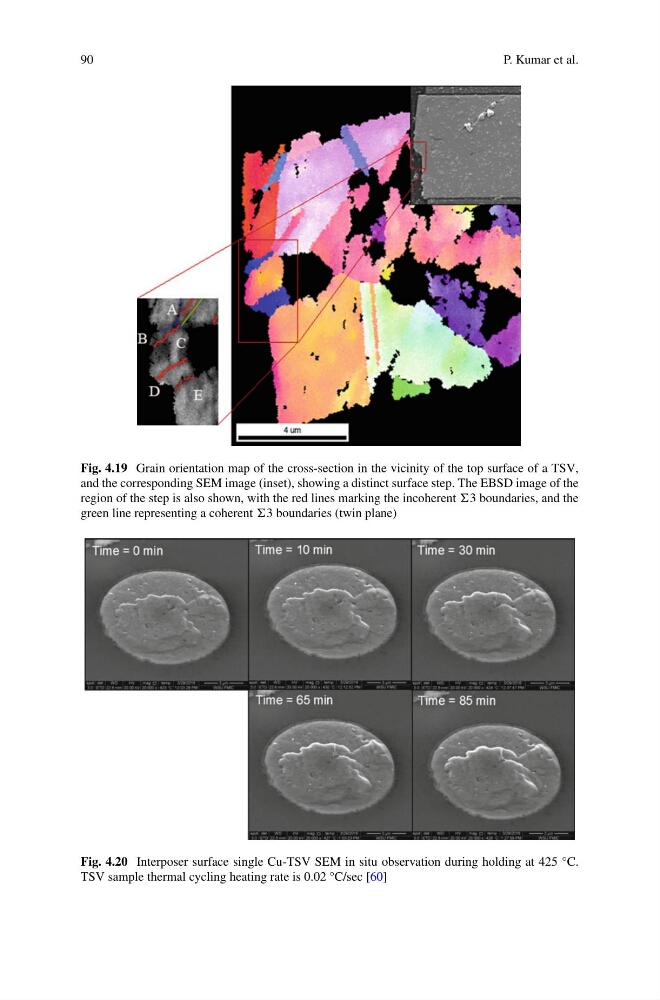
Fig. 4.19 Grain orientation map of the cross-section in the vicinity of the top surface of a TSV,
and the corresponding SEM image (inset), showing a distinct surface step. The EBSD image of the
region of the step is also shown, with the red lines marking the incoherent 3 boundaries, and the
green line representing a coherent 3 boundaries (twin plane)
Fig. 4.20 Interposer surface single Cu-TSV SEM in situ observation during holding at 425 °C.
TSV sample thermal cycling heating rate is 0.02 °C/sec [60]
P. Kumar et al.
Fig. 4.19 Grain orientation map of the cross-section in the vicinity of the top surface of a TSV,
and the corresponding SEM image (inset), showing a distinct surface step. The EBSD image of the
region of the step is also shown, with the red lines marking the incoherent 3 boundaries, and the
green line representing a coherent 3 boundaries (twin plane)
Fig. 4.20 Interposer surface single Cu-TSV SEM in situ observation during holding at 425 °C.
TSV sample thermal cycling heating rate is 0.02 °C/sec [60]