

4 Microstructure and Mechanical Reliability Issues of TSV
85
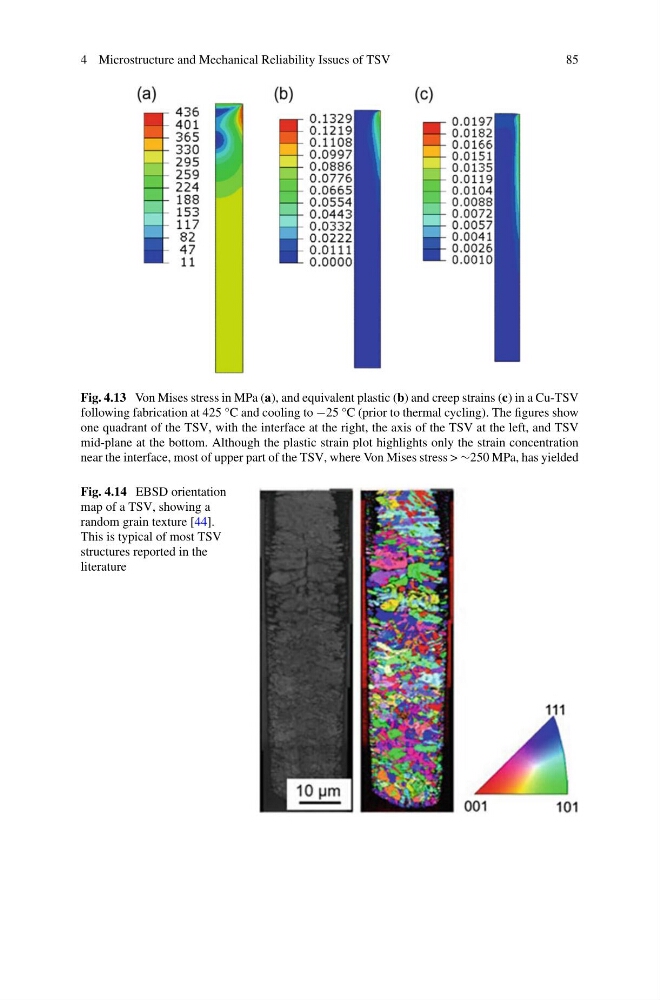
Fig. 4.13 Von Mises stress in MPa (a), and equivalent plastic (b) and creep strains (c) in a Cu-TSV
following fabrication at 425 °C and cooling to −25 °C (prior to thermal cycling). The figures show
one quadrant of the TSV, with the interface at the right, the axis of the TSV at the left, and TSV
mid-plane at the bottom. Although the plastic strain plot highlights only the strain concentration
near the interface, most of upper part of the TSV, where Von Mises stress > ∼250 MPa, has yielded
Fig. 4.14 EBSD orientation
map of a TSV, showing a
random grain texture [44].
This is typical of most TSV
structures reported in the
literature
85
Fig. 4.13 Von Mises stress in MPa (a), and equivalent plastic (b) and creep strains (c) in a Cu-TSV
following fabrication at 425 °C and cooling to −25 °C (prior to thermal cycling). The figures show
one quadrant of the TSV, with the interface at the right, the axis of the TSV at the left, and TSV
mid-plane at the bottom. Although the plastic strain plot highlights only the strain concentration
near the interface, most of upper part of the TSV, where Von Mises stress > ∼250 MPa, has yielded
Fig. 4.14 EBSD orientation
map of a TSV, showing a
random grain texture [44].
This is typical of most TSV
structures reported in the
literature