

72
dry basis (Dinuccio et al. 2010; Lei et al. 2010). The typical C/N ratios for untreated
rice straw are approximately from 40 to 80 (Tran et al. 2014; Arvanitoyannis and
Tsherkezou 2008; Ghosh and Bhattacharyya 1999). The effect of the C/N ratio on
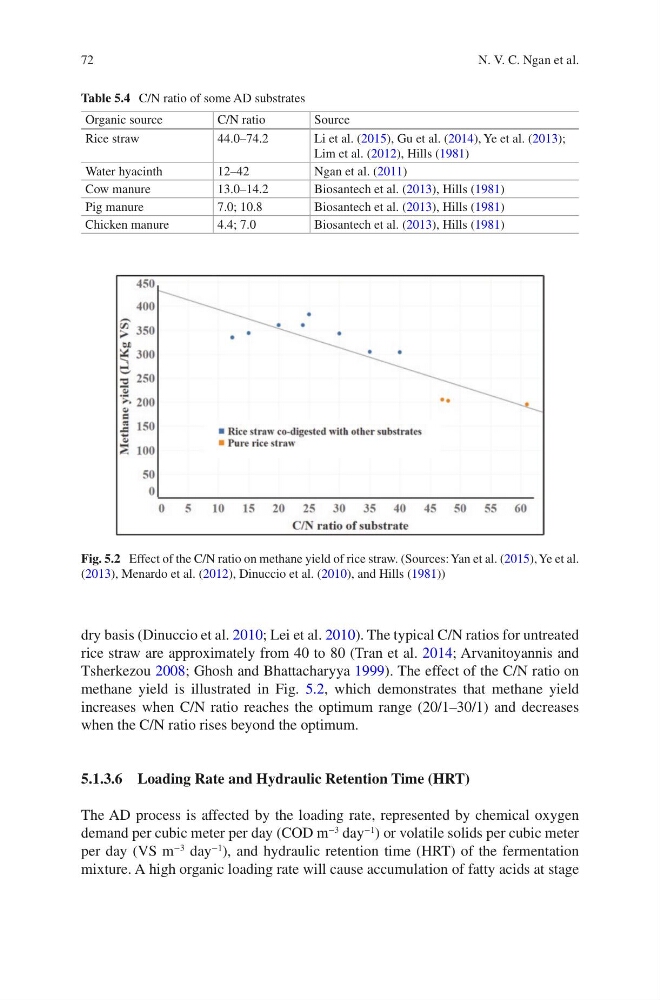
methane yield is illustrated in Fig. 5.2, which demonstrates that methane yield
increases when C/N ratio reaches the optimum range (20/1–30/1) and decreases
when the C/N ratio rises beyond the optimum.
5.1.3.6 Loading Rate and Hydraulic Retention Time (HRT)
The AD process is affected by the loading rate, represented by chemical oxygen
demand per cubic meter per day (COD m
−3
day
−1
) or volatile solids per cubic meter
per day (VS m
−3
day
−1
), and hydraulic retention time (HRT) of the fermentation
mixture. A high organic loading rate will cause accumulation of fatty acids at stage
Table 5.4 C/N ratio of some AD substrates
Organic source
C/N ratio
Source
Rice straw
44.0–74.2
Li et al. (2015), Gu et al. (2014), Ye et al. (2013);
Lim et al. (2012), Hills (1981)
Water hyacinth
12–42
Ngan et al. (2011)
Cow manure
13.0–14.2
Biosantech et al. (2013), Hills (1981)
Pig manure
7.0; 10.8
Biosantech et al. (2013), Hills (1981)
Chicken manure
4.4; 7.0
Biosantech et al. (2013), Hills (1981)
Fig. 5.2 Effect of the C/N ratio on methane yield of rice straw. (Sources: Yan et al. (2015), Ye et al.
(2013), Menardo et al. (2012), Dinuccio et al. (2010), and Hills (1981))
N. V. C. Ngan et al.
dry basis (Dinuccio et al. 2010; Lei et al. 2010). The typical C/N ratios for untreated
rice straw are approximately from 40 to 80 (Tran et al. 2014; Arvanitoyannis and
Tsherkezou 2008; Ghosh and Bhattacharyya 1999). The effect of the C/N ratio on
methane yield is illustrated in Fig. 5.2, which demonstrates that methane yield
increases when C/N ratio reaches the optimum range (20/1–30/1) and decreases
when the C/N ratio rises beyond the optimum.
5.1.3.6 Loading Rate and Hydraulic Retention Time (HRT)
The AD process is affected by the loading rate, represented by chemical oxygen
demand per cubic meter per day (COD m
−3
day
−1
) or volatile solids per cubic meter
per day (VS m
−3
day
−1
), and hydraulic retention time (HRT) of the fermentation
mixture. A high organic loading rate will cause accumulation of fatty acids at stage
Table 5.4 C/N ratio of some AD substrates
Organic source
C/N ratio
Source
Rice straw
44.0–74.2
Li et al. (2015), Gu et al. (2014), Ye et al. (2013);
Lim et al. (2012), Hills (1981)
Water hyacinth
12–42
Ngan et al. (2011)
Cow manure
13.0–14.2
Biosantech et al. (2013), Hills (1981)
Pig manure
7.0; 10.8
Biosantech et al. (2013), Hills (1981)
Chicken manure
4.4; 7.0
Biosantech et al. (2013), Hills (1981)
Fig. 5.2 Effect of the C/N ratio on methane yield of rice straw. (Sources: Yan et al. (2015), Ye et al.
(2013), Menardo et al. (2012), Dinuccio et al. (2010), and Hills (1981))
N. V. C. Ngan et al.