

167
10.2.2 Normalization and Weighting
Normalization is a process to calculate the magnitude of the results of the impact
indicators, relative to some reference information. Normalized results of the characterized factors, such as for each person per year, are calculated by dividing the
characterized results by the normalization factors, which are standardized in ISO
14044 (Guinée et al. 2001). Normalization factors are different for midpoint and
endpoint impact categories. These are described in Budavari et al. (2011).
Weighting is aimed at expressing the impact results for each category in numerical factors. Weighting is based on value choices or votes. For instance, there are
different votes for the importance of different categories, e.g., climate change and
human toxicity, in different regions or countries. Weighting factors of some common impact categories are presented in Budavari et al. (2011) and Guinée
et al. (2001).
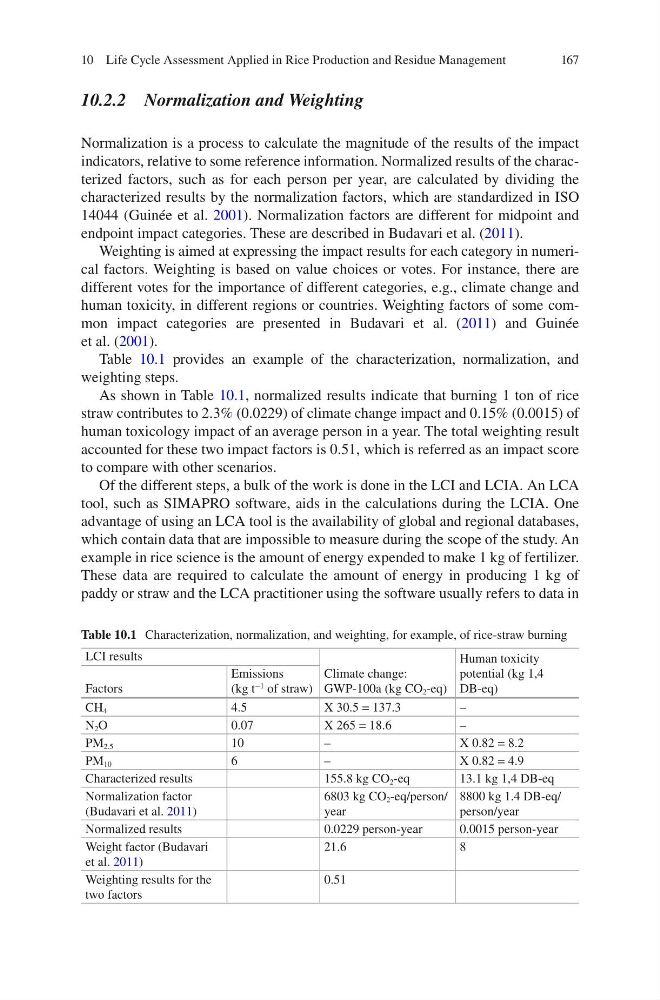
Table 10.1 provides an example of the characterization, normalization, and
weighting steps.
As shown in Table 10.1, normalized results indicate that burning 1 ton of rice
straw contributes to 2.3% (0.0229) of climate change impact and 0.15% (0.0015) of
human toxicology impact of an average person in a year. The total weighting result
accounted for these two impact factors is 0.51, which is referred as an impact score
to compare with other scenarios.
Of the different steps, a bulk of the work is done in the LCI and LCIA. An LCA
tool, such as SIMAPRO software, aids in the calculations during the LCIA. One
advantage of using an LCA tool is the availability of global and regional databases,
which contain data that are impossible to measure during the scope of the study. An
example in rice science is the amount of energy expended to make 1 kg of fertilizer.
These data are required to calculate the amount of energy in producing 1 kg of
paddy or straw and the LCA practitioner using the software usually refers to data in
Table 10.1 Characterization, normalization, and weighting, for example, of rice-straw burning
LCI results
Climate change:
GWP-100a (kg CO 2 -eq)
Human toxicity
potential (kg 1,4
DB-eq)
Factors
Emissions
(kg t
−1 of straw)
CH 4
4.5
X 30.5 = 137.3
–
N 2 O
0.07
X 265 = 18.6
–
PM 2.5
10
–
X 0.82 = 8.2
PM 10
6
–
X 0.82 = 4.9
Characterized results
155.8 kg CO 2 -eq
13.1 kg 1,4 DB-eq
Normalization factor
(Budavari et al. 2011)
6803 kg CO 2 -eq/person/
year
8800 kg 1.4 DB-eq/
person/year
Normalized results
0.0229 person-year
0.0015 person-year
Weight factor (Budavari
et al. 2011)
21.6
8
Weighting results for the
two factors
0.51
10 Life Cycle Assessment Applied in Rice Production and Residue Management
10.2.2 Normalization and Weighting
Normalization is a process to calculate the magnitude of the results of the impact
indicators, relative to some reference information. Normalized results of the characterized factors, such as for each person per year, are calculated by dividing the
characterized results by the normalization factors, which are standardized in ISO
14044 (Guinée et al. 2001). Normalization factors are different for midpoint and
endpoint impact categories. These are described in Budavari et al. (2011).
Weighting is aimed at expressing the impact results for each category in numerical factors. Weighting is based on value choices or votes. For instance, there are
different votes for the importance of different categories, e.g., climate change and
human toxicity, in different regions or countries. Weighting factors of some common impact categories are presented in Budavari et al. (2011) and Guinée
et al. (2001).
Table 10.1 provides an example of the characterization, normalization, and
weighting steps.
As shown in Table 10.1, normalized results indicate that burning 1 ton of rice
straw contributes to 2.3% (0.0229) of climate change impact and 0.15% (0.0015) of
human toxicology impact of an average person in a year. The total weighting result
accounted for these two impact factors is 0.51, which is referred as an impact score
to compare with other scenarios.
Of the different steps, a bulk of the work is done in the LCI and LCIA. An LCA
tool, such as SIMAPRO software, aids in the calculations during the LCIA. One
advantage of using an LCA tool is the availability of global and regional databases,
which contain data that are impossible to measure during the scope of the study. An
example in rice science is the amount of energy expended to make 1 kg of fertilizer.
These data are required to calculate the amount of energy in producing 1 kg of
paddy or straw and the LCA practitioner using the software usually refers to data in
Table 10.1 Characterization, normalization, and weighting, for example, of rice-straw burning
LCI results
Climate change:
GWP-100a (kg CO 2 -eq)
Human toxicity
potential (kg 1,4
DB-eq)
Factors
Emissions
(kg t
−1 of straw)
CH 4
4.5
X 30.5 = 137.3
–
N 2 O
0.07
X 265 = 18.6
–
PM 2.5
10
–
X 0.82 = 8.2
PM 10
6
–
X 0.82 = 4.9
Characterized results
155.8 kg CO 2 -eq
13.1 kg 1,4 DB-eq
Normalization factor
(Budavari et al. 2011)
6803 kg CO 2 -eq/person/
year
8800 kg 1.4 DB-eq/
person/year
Normalized results
0.0229 person-year
0.0015 person-year
Weight factor (Budavari
et al. 2011)
21.6
8
Weighting results for the
two factors
0.51
10 Life Cycle Assessment Applied in Rice Production and Residue Management