

165
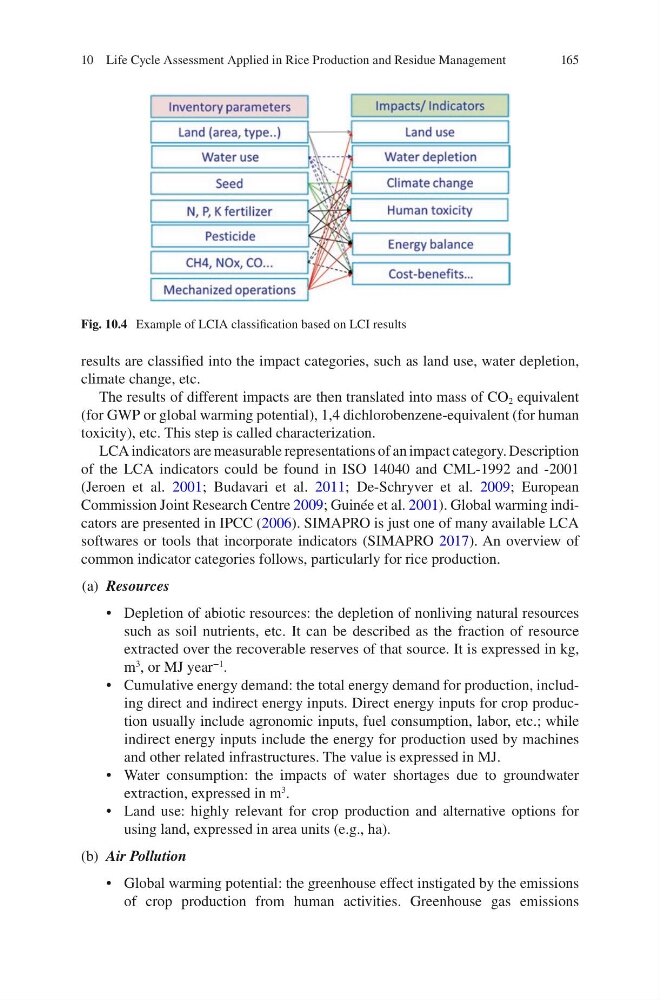
results are classified into the impact categories, such as land use, water depletion,
climate change, etc.
The results of different impacts are then translated into mass of CO 2 equivalent
(for GWP or global warming potential), 1,4 dichlorobenzene-equivalent (for human
toxicity), etc. This step is called characterization.
LCA indicators are measurable representations of an impact category. Description
of the LCA indicators could be found in ISO 14040 and CML-1992 and -2001
(Jeroen et al. 2001; Budavari et al. 2011; De-Schryver et al. 2009; European
Commission Joint Research Centre 2009; Guinée et al. 2001). Global warming indicators are presented in IPCC (2006). SIMAPRO is just one of many available LCA
softwares or tools that incorporate indicators (SIMAPRO 2017). An overview of
common indicator categories follows, particularly for rice production.
(a) Resources
• Depletion of abiotic resources: the depletion of nonliving natural resources
such as soil nutrients, etc. It can be described as the fraction of resource
extracted over the recoverable reserves of that source. It is expressed in kg,
m
3
, or MJ year
−1
.
• Cumulative energy demand: the total energy demand for production, including direct and indirect energy inputs. Direct energy inputs for crop production usually include agronomic inputs, fuel consumption, labor, etc.; while
indirect energy inputs include the energy for production used by machines
and other related infrastructures. The value is expressed in MJ.
• Water consumption: the impacts of water shortages due to groundwater
extraction, expressed in m
3
.
• Land use: highly relevant for crop production and alternative options for
using land, expressed in area units (e.g., ha).
(b) Air Pollution
• Global warming potential: the greenhouse effect instigated by the emissions
of crop production from human activities. Greenhouse gas emissions
Fig. 10.4 Example of LCIA classification based on LCI results
10 Life Cycle Assessment Applied in Rice Production and Residue Management
results are classified into the impact categories, such as land use, water depletion,
climate change, etc.
The results of different impacts are then translated into mass of CO 2 equivalent
(for GWP or global warming potential), 1,4 dichlorobenzene-equivalent (for human
toxicity), etc. This step is called characterization.
LCA indicators are measurable representations of an impact category. Description
of the LCA indicators could be found in ISO 14040 and CML-1992 and -2001
(Jeroen et al. 2001; Budavari et al. 2011; De-Schryver et al. 2009; European
Commission Joint Research Centre 2009; Guinée et al. 2001). Global warming indicators are presented in IPCC (2006). SIMAPRO is just one of many available LCA
softwares or tools that incorporate indicators (SIMAPRO 2017). An overview of
common indicator categories follows, particularly for rice production.
(a) Resources
• Depletion of abiotic resources: the depletion of nonliving natural resources
such as soil nutrients, etc. It can be described as the fraction of resource
extracted over the recoverable reserves of that source. It is expressed in kg,
m
3
, or MJ year
−1
.
• Cumulative energy demand: the total energy demand for production, including direct and indirect energy inputs. Direct energy inputs for crop production usually include agronomic inputs, fuel consumption, labor, etc.; while
indirect energy inputs include the energy for production used by machines
and other related infrastructures. The value is expressed in MJ.
• Water consumption: the impacts of water shortages due to groundwater
extraction, expressed in m
3
.
• Land use: highly relevant for crop production and alternative options for
using land, expressed in area units (e.g., ha).
(b) Air Pollution
• Global warming potential: the greenhouse effect instigated by the emissions
of crop production from human activities. Greenhouse gas emissions
Fig. 10.4 Example of LCIA classification based on LCI results
10 Life Cycle Assessment Applied in Rice Production and Residue Management