

The technical team assessed CRM processes through the use of Brooks score
card.
9 The score card measures CRM indicators in Track 1 through 8 parameters,
namely, climate change mainstreaming/integration into planning, institutional
coordination, budgeting and finance, institutional knowledge/capacity, use of climate information, planning under uncertainty, participation, and awareness among
stakeholders. Under each parameter, there are five questions that need to be
answered before scores are assigned. The type of scoring is chosen by stakeholders
in terms of weighting (0–4) or percentages. In Isiolo County, percentages were used
to depict the extent to which progress against the indicator was being made. The
score card and its results are shown in Table 15.1.
15.2.2 Bottom-Up (Track 2) Process
Before communities were facilitated to develop ToCs per ward, it was important
that communities defined the term resilience in their own context so as to understand how their planned adaptation actions contributed to resilience. The
researchers worked with six WAPCs to identify 20 ward adaptation/development
interventions covering the water, livestock, and natural resource governance sectors
that were in planning phases. Each of these wards was then assisted in developing
their own specific ToC, identifying outputs, outcomes, long term impact, indicators
and assumptions.
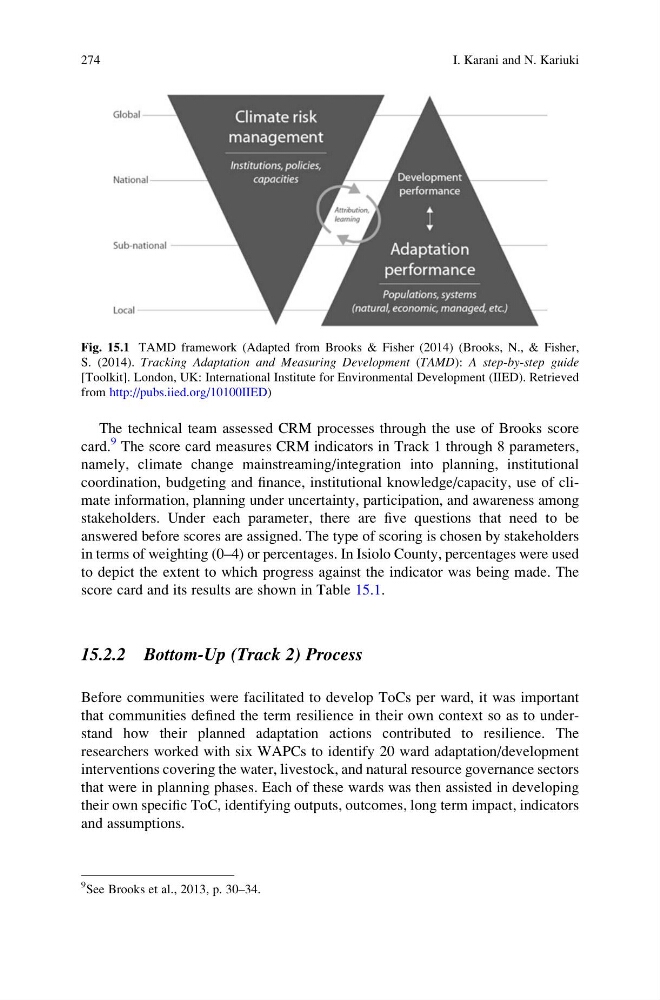
Fig. 15.1 TAMD framework (Adapted from Brooks & Fisher (2014) (Brooks, N., & Fisher,
S. (2014). Tracking Adaptation and Measuring Development (TAMD): A step-by-step guide
[Toolkit]. London, UK: International Institute for Environmental Development (IIED). Retrieved
from http://pubs.iied.org/10100IIED)
9 See Brooks et al., 2013, p. 30–34.
274
I. Karani and N. Kariuki
card.
9 The score card measures CRM indicators in Track 1 through 8 parameters,
namely, climate change mainstreaming/integration into planning, institutional
coordination, budgeting and finance, institutional knowledge/capacity, use of climate information, planning under uncertainty, participation, and awareness among
stakeholders. Under each parameter, there are five questions that need to be
answered before scores are assigned. The type of scoring is chosen by stakeholders
in terms of weighting (0–4) or percentages. In Isiolo County, percentages were used
to depict the extent to which progress against the indicator was being made. The
score card and its results are shown in Table 15.1.
15.2.2 Bottom-Up (Track 2) Process
Before communities were facilitated to develop ToCs per ward, it was important
that communities defined the term resilience in their own context so as to understand how their planned adaptation actions contributed to resilience. The
researchers worked with six WAPCs to identify 20 ward adaptation/development
interventions covering the water, livestock, and natural resource governance sectors
that were in planning phases. Each of these wards was then assisted in developing
their own specific ToC, identifying outputs, outcomes, long term impact, indicators
and assumptions.
Fig. 15.1 TAMD framework (Adapted from Brooks & Fisher (2014) (Brooks, N., & Fisher,
S. (2014). Tracking Adaptation and Measuring Development (TAMD): A step-by-step guide
[Toolkit]. London, UK: International Institute for Environmental Development (IIED). Retrieved
from http://pubs.iied.org/10100IIED)
9 See Brooks et al., 2013, p. 30–34.
274
I. Karani and N. Kariuki