

10.3.2 Greenhouse Gas Emission Reduction and Avoided
Emissions
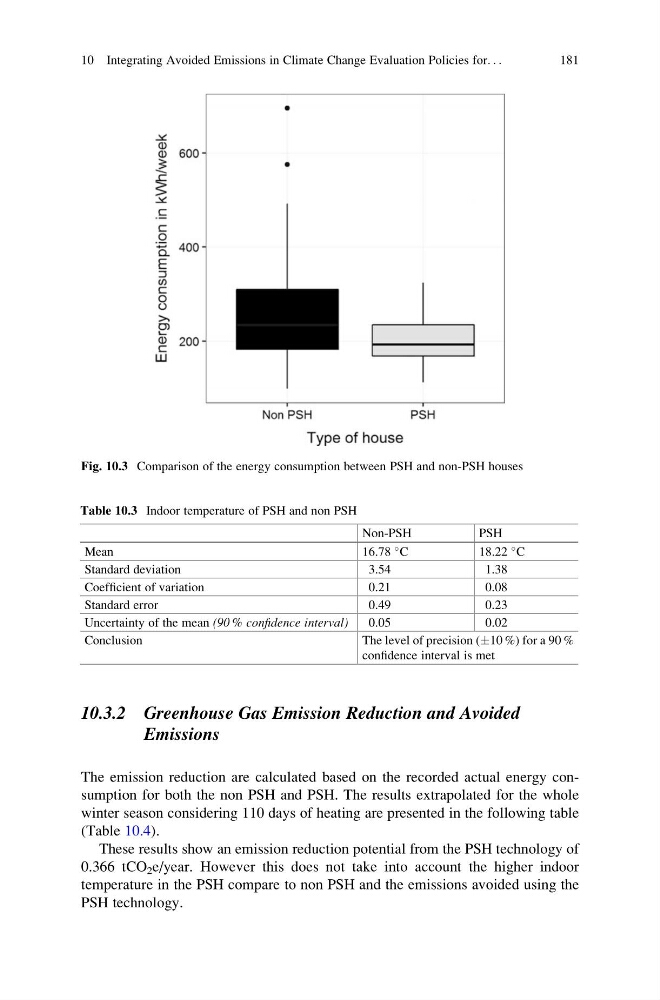
The emission reduction are calculated based on the recorded actual energy consumption for both the non PSH and PSH. The results extrapolated for the whole
winter season considering 110 days of heating are presented in the following table
(Table 10.4).
These results show an emission reduction potential from the PSH technology of
0.366 tCO 2 e/year. However this does not take into account the higher indoor
temperature in the PSH compare to non PSH and the emissions avoided using the
PSH technology.
Fig. 10.3 Comparison of the energy consumption between PSH and non-PSH houses
Table 10.3 Indoor temperature of PSH and non PSH
Non-PSH
PSH
Mean
16.78
C
18.22
C
Standard deviation
3.54
1.38
Coefficient of variation
0.21
0.08
Standard error
0.49
0.23
Uncertainty of the mean (90 % confidence interval)
0.05
0.02
Conclusion
The level of precision (Æ10 %) for a 90 %
confidence interval is met
10 Integrating Avoided Emissions in Climate Change Evaluation Policies for. . .
181
Emissions
The emission reduction are calculated based on the recorded actual energy consumption for both the non PSH and PSH. The results extrapolated for the whole
winter season considering 110 days of heating are presented in the following table
(Table 10.4).
These results show an emission reduction potential from the PSH technology of
0.366 tCO 2 e/year. However this does not take into account the higher indoor
temperature in the PSH compare to non PSH and the emissions avoided using the
PSH technology.
Fig. 10.3 Comparison of the energy consumption between PSH and non-PSH houses
Table 10.3 Indoor temperature of PSH and non PSH
Non-PSH
PSH
Mean
16.78
C
18.22
C
Standard deviation
3.54
1.38
Coefficient of variation
0.21
0.08
Standard error
0.49
0.23
Uncertainty of the mean (90 % confidence interval)
0.05
0.02
Conclusion
The level of precision (Æ10 %) for a 90 %
confidence interval is met
10 Integrating Avoided Emissions in Climate Change Evaluation Policies for. . .
181