

10.3.1.2 Energy Savings
For the two groups, firewood was the main fuel consumed, representing approximately the two-thirds of the energy consumption for heating purpose. The
remaining energy consumed was a mix of coal, sawdust, cow dung, husk and
cardboard. This fuel mix is representative of the energy consumption patterns of
Kabul according to the SEADEP results (Fig. 10.2).
The results of the analysis of the energy consumption of the monitored room
over the 8 weeks monitoring period are presented in the Table 10.2.
The PSH energy consumption was 23 % lower than non-PSH houses, with a net
energy consumption decrease of 60 kWh per week in average (Fig. 10.3). Extrapolated to 1 year considering 110 heating days that represents a saving of 938 kWh
per year for each house equipped with PSH.
10.3.1.3 Indoor Temperature
The analysis of the temperature recorded in the main heated room, attached to the
veranda for the PSH, during the monitoring period shows the following results
(Table 10.3).
Over the monitoring period, the PSH reached an average weekly indoor temperature of 18.22
C. The PSH average temperature is 8 % higher than non-PSH
houses, with a net increase of 1.43
C of the weekly indoor average temperature.
The variation of the PSH indoor temperature was also much lower than the non PSH
(Fig. 10.4).
This difference show that, in addition of reducing fuel consumption, the PSH
group reached the WHO recommended minimum indoor temperature of 18
C.
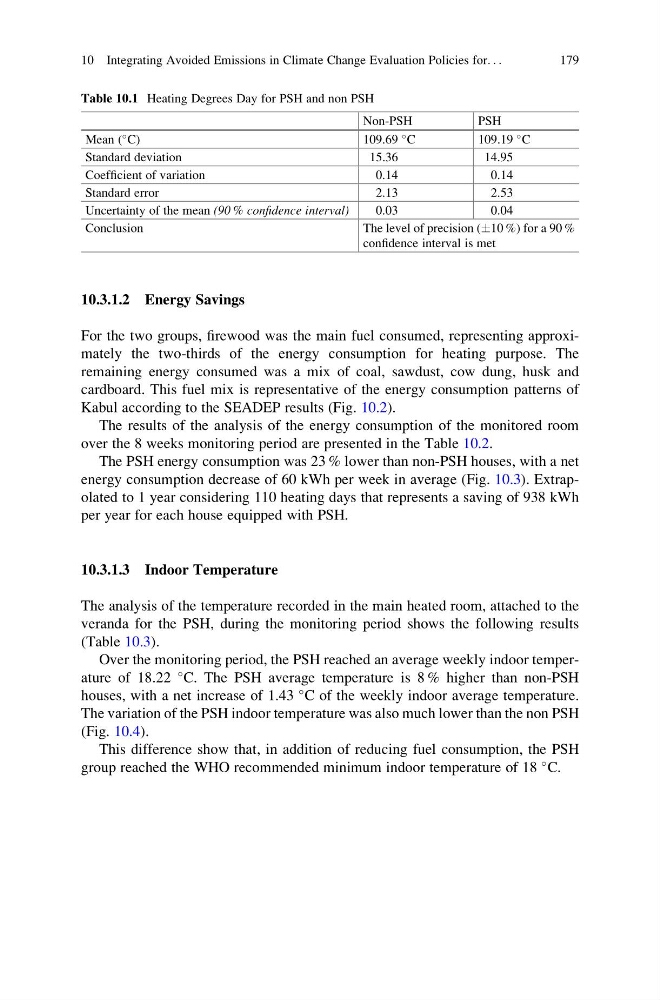
Table 10.1 Heating Degrees Day for PSH and non PSH
Non-PSH
PSH
Mean (
C)
109.69
C
109.19
C
Standard deviation
15.36
14.95
Coefficient of variation
0.14
0.14
Standard error
2.13
2.53
Uncertainty of the mean (90 % confidence interval)
0.03
0.04
Conclusion
The level of precision (Æ10 %) for a 90 %
confidence interval is met
10 Integrating Avoided Emissions in Climate Change Evaluation Policies for. . .
179
For the two groups, firewood was the main fuel consumed, representing approximately the two-thirds of the energy consumption for heating purpose. The
remaining energy consumed was a mix of coal, sawdust, cow dung, husk and
cardboard. This fuel mix is representative of the energy consumption patterns of
Kabul according to the SEADEP results (Fig. 10.2).
The results of the analysis of the energy consumption of the monitored room
over the 8 weeks monitoring period are presented in the Table 10.2.
The PSH energy consumption was 23 % lower than non-PSH houses, with a net
energy consumption decrease of 60 kWh per week in average (Fig. 10.3). Extrapolated to 1 year considering 110 heating days that represents a saving of 938 kWh
per year for each house equipped with PSH.
10.3.1.3 Indoor Temperature
The analysis of the temperature recorded in the main heated room, attached to the
veranda for the PSH, during the monitoring period shows the following results
(Table 10.3).
Over the monitoring period, the PSH reached an average weekly indoor temperature of 18.22
C. The PSH average temperature is 8 % higher than non-PSH
houses, with a net increase of 1.43
C of the weekly indoor average temperature.
The variation of the PSH indoor temperature was also much lower than the non PSH
(Fig. 10.4).
This difference show that, in addition of reducing fuel consumption, the PSH
group reached the WHO recommended minimum indoor temperature of 18
C.
Table 10.1 Heating Degrees Day for PSH and non PSH
Non-PSH
PSH
Mean (
C)
109.69
C
109.19
C
Standard deviation
15.36
14.95
Coefficient of variation
0.14
0.14
Standard error
2.13
2.53
Uncertainty of the mean (90 % confidence interval)
0.03
0.04
Conclusion
The level of precision (Æ10 %) for a 90 %
confidence interval is met
10 Integrating Avoided Emissions in Climate Change Evaluation Policies for. . .
179