

PE ¼ Project emissions for the PSH (tCO 2 e/year)
LE ¼ Leakage (tCO 2 e/year)
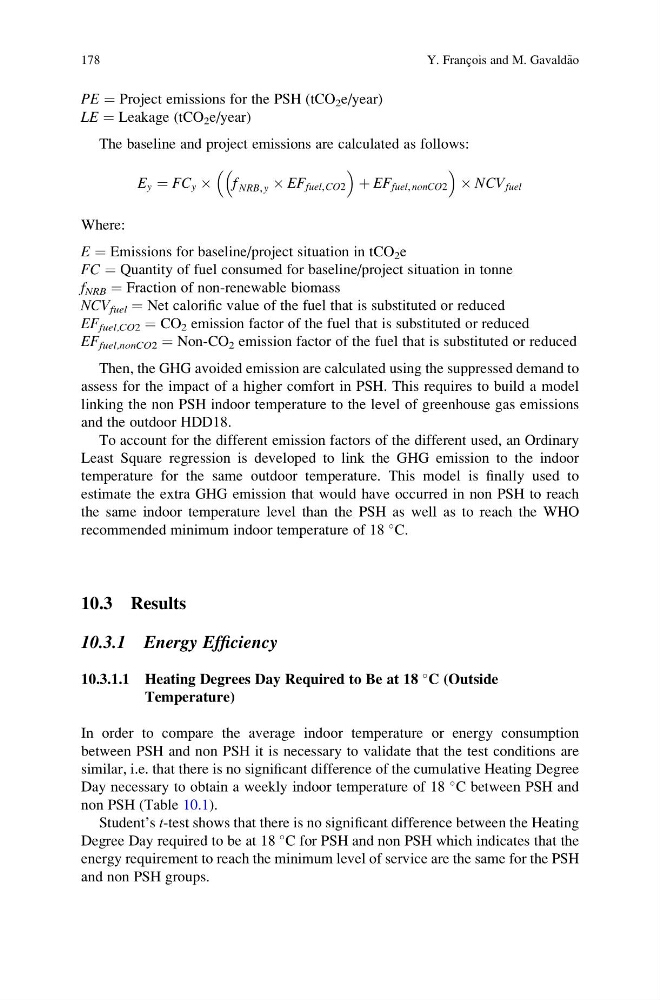
The baseline and project emissions are calculated as follows:
E y ¼ FC y  f NRB, y  EF fuel, CO2
þ EF fuel, nonCO2
 NCV fuel
Where:
E ¼ Emissions for baseline/project situation in tCO 2 e
FC ¼ Quantity of fuel consumed for baseline/project situation in tonne
f NRB ¼ Fraction of non-renewable biomass
NCV fuel ¼ Net calorific value of the fuel that is substituted or reduced
EF fuel,CO2 ¼ CO 2 emission factor of the fuel that is substituted or reduced
EF fuel,nonCO2 ¼ Non-CO 2 emission factor of the fuel that is substituted or reduced
Then, the GHG avoided emission are calculated using the suppressed demand to
assess for the impact of a higher comfort in PSH. This requires to build a model
linking the non PSH indoor temperature to the level of greenhouse gas emissions
and the outdoor HDD18.
To account for the different emission factors of the different used, an Ordinary
Least Square regression is developed to link the GHG emission to the indoor
temperature for the same outdoor temperature. This model is finally used to
estimate the extra GHG emission that would have occurred in non PSH to reach
the same indoor temperature level than the PSH as well as to reach the WHO
recommended minimum indoor temperature of 18
C.
10.3 Results
10.3.1 Energy Efficiency
10.3.1.1 Heating Degrees Day Required to Be at 18
C (Outside
Temperature)
In order to compare the average indoor temperature or energy consumption
between PSH and non PSH it is necessary to validate that the test conditions are
similar, i.e. that there is no significant difference of the cumulative Heating Degree
Day necessary to obtain a weekly indoor temperature of 18
C between PSH and
non PSH (Table 10.1).
Student’s t-test shows that there is no significant difference between the Heating
Degree Day required to be at 18
C for PSH and non PSH which indicates that the
energy requirement to reach the minimum level of service are the same for the PSH
and non PSH groups.
178
Y. Franc ¸ois and M. Gavald~ ao
LE ¼ Leakage (tCO 2 e/year)
The baseline and project emissions are calculated as follows:
E y ¼ FC y  f NRB, y  EF fuel, CO2
þ EF fuel, nonCO2
 NCV fuel
Where:
E ¼ Emissions for baseline/project situation in tCO 2 e
FC ¼ Quantity of fuel consumed for baseline/project situation in tonne
f NRB ¼ Fraction of non-renewable biomass
NCV fuel ¼ Net calorific value of the fuel that is substituted or reduced
EF fuel,CO2 ¼ CO 2 emission factor of the fuel that is substituted or reduced
EF fuel,nonCO2 ¼ Non-CO 2 emission factor of the fuel that is substituted or reduced
Then, the GHG avoided emission are calculated using the suppressed demand to
assess for the impact of a higher comfort in PSH. This requires to build a model
linking the non PSH indoor temperature to the level of greenhouse gas emissions
and the outdoor HDD18.
To account for the different emission factors of the different used, an Ordinary
Least Square regression is developed to link the GHG emission to the indoor
temperature for the same outdoor temperature. This model is finally used to
estimate the extra GHG emission that would have occurred in non PSH to reach
the same indoor temperature level than the PSH as well as to reach the WHO
recommended minimum indoor temperature of 18
C.
10.3 Results
10.3.1 Energy Efficiency
10.3.1.1 Heating Degrees Day Required to Be at 18
C (Outside
Temperature)
In order to compare the average indoor temperature or energy consumption
between PSH and non PSH it is necessary to validate that the test conditions are
similar, i.e. that there is no significant difference of the cumulative Heating Degree
Day necessary to obtain a weekly indoor temperature of 18
C between PSH and
non PSH (Table 10.1).
Student’s t-test shows that there is no significant difference between the Heating
Degree Day required to be at 18
C for PSH and non PSH which indicates that the
energy requirement to reach the minimum level of service are the same for the PSH
and non PSH groups.
178
Y. Franc ¸ois and M. Gavald~ ao