

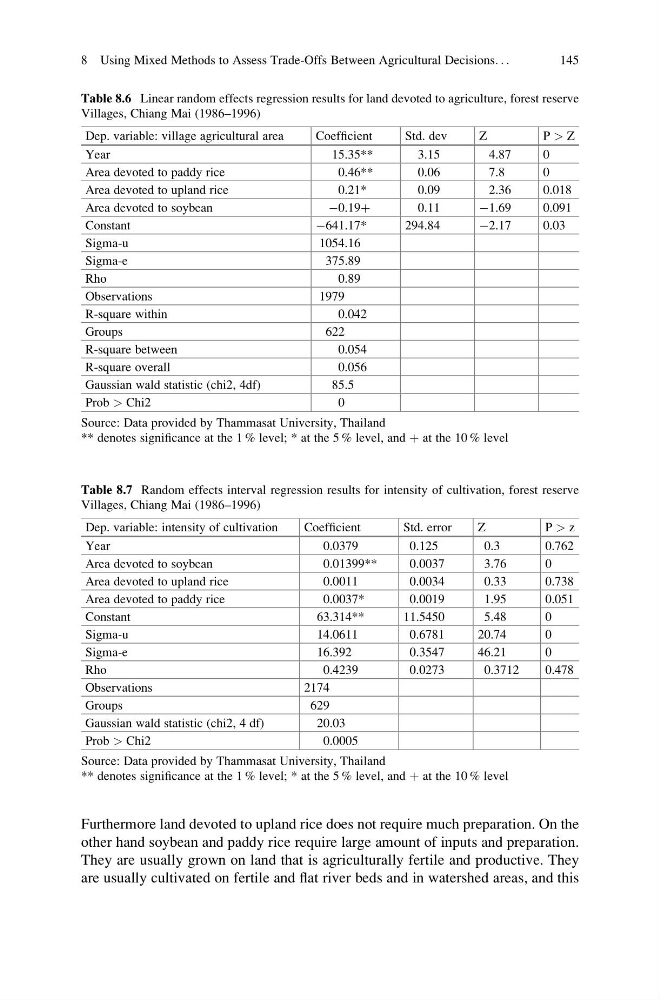
Furthermore land devoted to upland rice does not require much preparation. On the
other hand soybean and paddy rice require large amount of inputs and preparation.
They are usually grown on land that is agriculturally fertile and productive. They
are usually cultivated on fertile and flat river beds and in watershed areas, and this
Table 8.6 Linear random effects regression results for land devoted to agriculture, forest reserve
Villages, Chiang Mai (1986–1996)
Dep. variable: village agricultural area
Coefficient
Std. dev
Z
P > Z
Year
15.35**
3.15
4.87
0
Area devoted to paddy rice
0.46**
0.06
7.8
0
Area devoted to upland rice
0.21*
0.09
2.36
0.018
Area devoted to soybean
À0.19þ
0.11
À1.69
0.091
Constant
À641.17*
294.84
À2.17
0.03
Sigma-u
1054.16
Sigma-e
375.89
Rho
0.89
Observations
1979
R-square within
0.042
Groups
622
R-square between
0.054
R-square overall
0.056
Gaussian wald statistic (chi2, 4df)
85.5
Prob > Chi2
0
Source: Data provided by Thammasat University, Thailand
** denotes significance at the 1 % level; * at the 5 % level, and þ at the 10 % level
Table 8.7 Random effects interval regression results for intensity of cultivation, forest reserve
Villages, Chiang Mai (1986–1996)
Dep. variable: intensity of cultivation
Coefficient
Std. error
Z
P > z
Year
0.0379
0.125
0.3
0.762
Area devoted to soybean
0.01399**
0.0037
3.76
0
Area devoted to upland rice
0.0011
0.0034
0.33
0.738
Area devoted to paddy rice
0.0037*
0.0019
1.95
0.051
Constant
63.314**
11.5450
5.48
0
Sigma-u
14.0611
0.6781
20.74
0
Sigma-e
16.392
0.3547
46.21
0
Rho
0.4239
0.0273
0.3712
0.478
Observations
2174
Groups
629
Gaussian wald statistic (chi2, 4 df)
20.03
Prob > Chi2
0.0005
Source: Data provided by Thammasat University, Thailand
** denotes significance at the 1 % level; * at the 5 % level, and þ at the 10 % level
8 Using Mixed Methods to Assess Trade-Offs Between Agricultural Decisions. . .
145
other hand soybean and paddy rice require large amount of inputs and preparation.
They are usually grown on land that is agriculturally fertile and productive. They
are usually cultivated on fertile and flat river beds and in watershed areas, and this
Table 8.6 Linear random effects regression results for land devoted to agriculture, forest reserve
Villages, Chiang Mai (1986–1996)
Dep. variable: village agricultural area
Coefficient
Std. dev
Z
P > Z
Year
15.35**
3.15
4.87
0
Area devoted to paddy rice
0.46**
0.06
7.8
0
Area devoted to upland rice
0.21*
0.09
2.36
0.018
Area devoted to soybean
À0.19þ
0.11
À1.69
0.091
Constant
À641.17*
294.84
À2.17
0.03
Sigma-u
1054.16
Sigma-e
375.89
Rho
0.89
Observations
1979
R-square within
0.042
Groups
622
R-square between
0.054
R-square overall
0.056
Gaussian wald statistic (chi2, 4df)
85.5
Prob > Chi2
0
Source: Data provided by Thammasat University, Thailand
** denotes significance at the 1 % level; * at the 5 % level, and þ at the 10 % level
Table 8.7 Random effects interval regression results for intensity of cultivation, forest reserve
Villages, Chiang Mai (1986–1996)
Dep. variable: intensity of cultivation
Coefficient
Std. error
Z
P > z
Year
0.0379
0.125
0.3
0.762
Area devoted to soybean
0.01399**
0.0037
3.76
0
Area devoted to upland rice
0.0011
0.0034
0.33
0.738
Area devoted to paddy rice
0.0037*
0.0019
1.95
0.051
Constant
63.314**
11.5450
5.48
0
Sigma-u
14.0611
0.6781
20.74
0
Sigma-e
16.392
0.3547
46.21
0
Rho
0.4239
0.0273
0.3712
0.478
Observations
2174
Groups
629
Gaussian wald statistic (chi2, 4 df)
20.03
Prob > Chi2
0.0005
Source: Data provided by Thammasat University, Thailand
** denotes significance at the 1 % level; * at the 5 % level, and þ at the 10 % level
8 Using Mixed Methods to Assess Trade-Offs Between Agricultural Decisions. . .
145