

36
3.2.3 Data Collection
The tourist questionnaire survey was conducted with randomized distribution at the
Amami Airport on Amami Oshima Island in August 2017. Nine hundred and
twenty-four questionnaires were distributed to tourists, of which 343 questionnaires
were returned by mail (the response rate was 37.1%); of these, 12 contained no
answers to any of the choice experiment questions and were thus omitted from
analysis. We ultimately used data of 331 respondents, and 1608 choice sets contained answers to all relevant questions. Of the about half of respondents (n = 175)
were provided ecological information, and 68.0% of respondents were female
(n = 217). The most represented age group was between 40 and 49 years of age
(n = 92), followed by respondents between 30 and 39 years of age (n = 84).
3.2.4 Econometric Model
To analyze the tourists’ preferences, we used a model based on random utility theory (McFadden 1974), which comprises an observable deterministic component
and an unobservable random component. According to this model, each individual’s
utility (U i ) of alternative i can be described as a function of an observable component (V i ) and an unobservable random (error) component (ε i ):
U
f V
V
i
i
i
i
i
= ( )= +
,ε
ε
(3.1)
The alternative i was chosen by the individual if U i > U j for all j ≠ i. Thus, the
probability that the respondent chooses the alternative i from choice set C is:
Tour 1
T our 2
Non-attend the
tours
Carp Removal option
Yes
N o
Tour Time (minutes)
60
150
Pick-up option
Yes
N o
Tour Fee (JPY)
5000
2500
Please circle
the answer
↓
↓
↓
ڭ
ڮ
گ
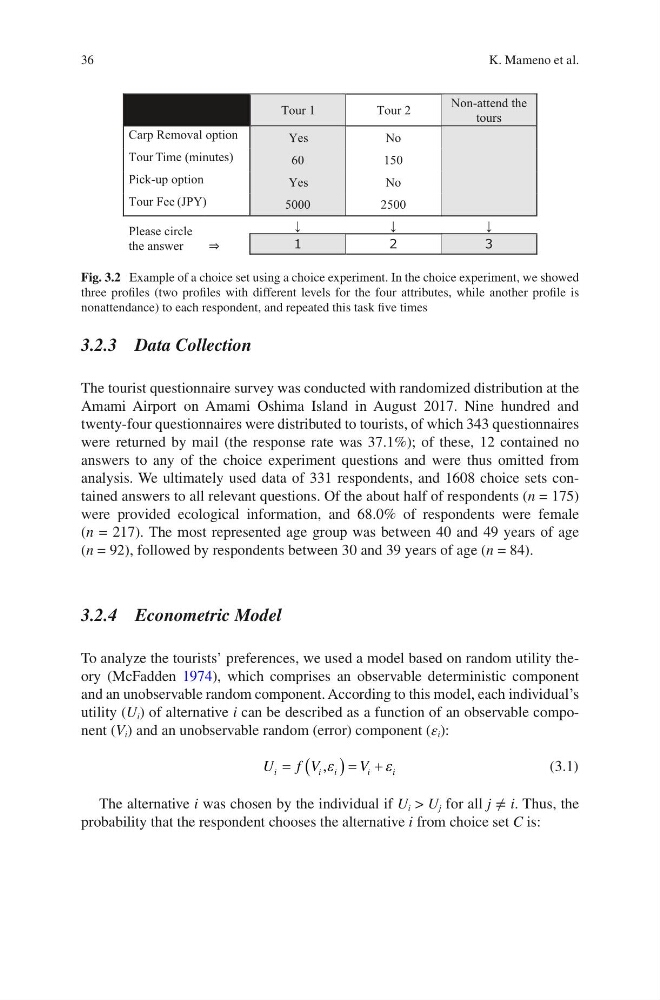
Fig. 3.2 Example of a choice set using a choice experiment. In the choice experiment, we showed
three profiles (two profiles with different levels for the four attributes, while another profile is
nonattendance) to each respondent, and repeated this task five times
K. Mameno et al.
3.2.3 Data Collection
The tourist questionnaire survey was conducted with randomized distribution at the
Amami Airport on Amami Oshima Island in August 2017. Nine hundred and
twenty-four questionnaires were distributed to tourists, of which 343 questionnaires
were returned by mail (the response rate was 37.1%); of these, 12 contained no
answers to any of the choice experiment questions and were thus omitted from
analysis. We ultimately used data of 331 respondents, and 1608 choice sets contained answers to all relevant questions. Of the about half of respondents (n = 175)
were provided ecological information, and 68.0% of respondents were female
(n = 217). The most represented age group was between 40 and 49 years of age
(n = 92), followed by respondents between 30 and 39 years of age (n = 84).
3.2.4 Econometric Model
To analyze the tourists’ preferences, we used a model based on random utility theory (McFadden 1974), which comprises an observable deterministic component
and an unobservable random component. According to this model, each individual’s
utility (U i ) of alternative i can be described as a function of an observable component (V i ) and an unobservable random (error) component (ε i ):
U
f V
V
i
i
i
i
i
= ( )= +
,ε
ε
(3.1)
The alternative i was chosen by the individual if U i > U j for all j ≠ i. Thus, the
probability that the respondent chooses the alternative i from choice set C is:
Tour 1
T our 2
Non-attend the
tours
Carp Removal option
Yes
N o
Tour Time (minutes)
60
150
Pick-up option
Yes
N o
Tour Fee (JPY)
5000
2500
Please circle
the answer
↓
↓
↓
ڭ
ڮ
گ
Fig. 3.2 Example of a choice set using a choice experiment. In the choice experiment, we showed
three profiles (two profiles with different levels for the four attributes, while another profile is
nonattendance) to each respondent, and repeated this task five times
K. Mameno et al.