

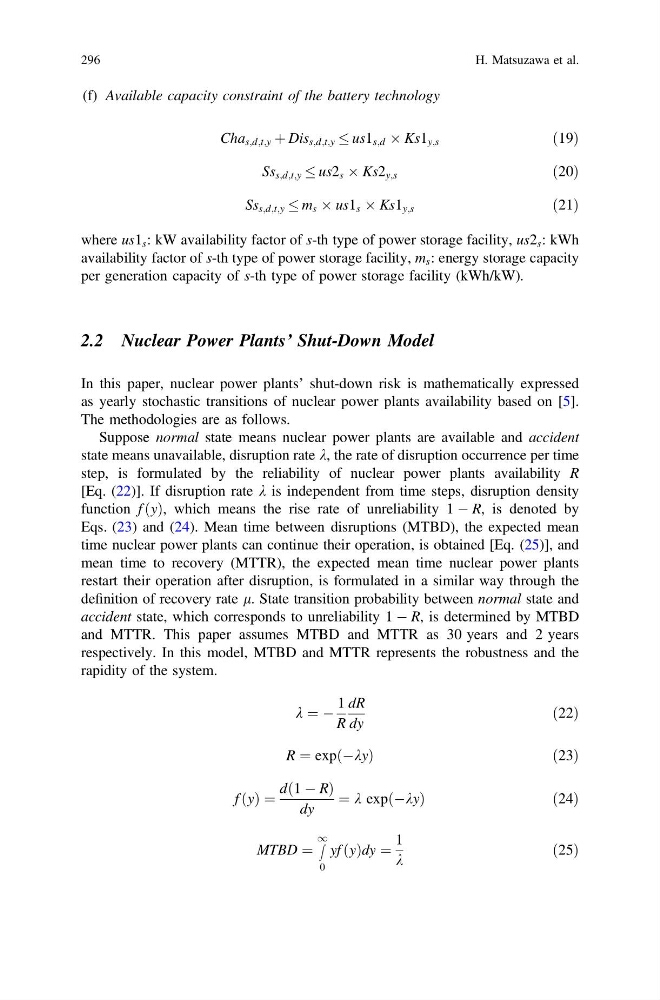
(f) Available capacity constraint of the battery technology
Cha s;d;t;y þ Dis s;d;t;y us1 s;d  Ks1 y;s
ð19Þ
Ss s;d;t;y us2 s  Ks2 y;s
ð20Þ
Ss s;d;t;y m s  us1 s  Ks1 y;s
ð21Þ
where us1 s : kW availability factor of s-th type of power storage facility, us2 s : kWh
availability factor of s-th type of power storage facility, m s : energy storage capacity
per generation capacity of s-th type of power storage facility (kWh/kW).
2.2 Nuclear Power Plants’ Shut-Down Model
In this paper, nuclear power plants’ shut-down risk is mathematically expressed
as yearly stochastic transitions of nuclear power plants availability based on [5].
The methodologies are as follows.
Suppose normal state means nuclear power plants are available and accident
state means unavailable, disruption rate k, the rate of disruption occurrence per time
step, is formulated by the reliability of nuclear power plants availability R
[Eq. (22)]. If disruption rate k is independent from time steps, disruption density
function f y
ð Þ, which means the rise rate of unreliability 1 À R, is denoted by
Eqs. (23) and (24). Mean time between disruptions (MTBD), the expected mean
time nuclear power plants can continue their operation, is obtained [Eq. (25)], and
mean time to recovery (MTTR), the expected mean time nuclear power plants
restart their operation after disruption, is formulated in a similar way through the
definition of recovery rate l. State transition probability between normal state and
accident state, which corresponds to unreliability 1 À R, is determined by MTBD
and MTTR. This paper assumes MTBD and MTTR as 30 years and 2 years
respectively. In this model, MTBD and MTTR represents the robustness and the
rapidity of the system.
k ¼ À
1
R
dR
dy
ð22Þ
R ¼ exp Àky
ð
Þ
ð23Þ
f y
ð Þ ¼
d 1 À R
ð
Þ
dy
¼ k exp Àky
ð
Þ
ð24Þ
MTBD ¼
Z
1
0
yf y
ð Þdy ¼
1
k
ð25Þ
296
H. Matsuzawa et al.
Cha s;d;t;y þ Dis s;d;t;y us1 s;d  Ks1 y;s
ð19Þ
Ss s;d;t;y us2 s  Ks2 y;s
ð20Þ
Ss s;d;t;y m s  us1 s  Ks1 y;s
ð21Þ
where us1 s : kW availability factor of s-th type of power storage facility, us2 s : kWh
availability factor of s-th type of power storage facility, m s : energy storage capacity
per generation capacity of s-th type of power storage facility (kWh/kW).
2.2 Nuclear Power Plants’ Shut-Down Model
In this paper, nuclear power plants’ shut-down risk is mathematically expressed
as yearly stochastic transitions of nuclear power plants availability based on [5].
The methodologies are as follows.
Suppose normal state means nuclear power plants are available and accident
state means unavailable, disruption rate k, the rate of disruption occurrence per time
step, is formulated by the reliability of nuclear power plants availability R
[Eq. (22)]. If disruption rate k is independent from time steps, disruption density
function f y
ð Þ, which means the rise rate of unreliability 1 À R, is denoted by
Eqs. (23) and (24). Mean time between disruptions (MTBD), the expected mean
time nuclear power plants can continue their operation, is obtained [Eq. (25)], and
mean time to recovery (MTTR), the expected mean time nuclear power plants
restart their operation after disruption, is formulated in a similar way through the
definition of recovery rate l. State transition probability between normal state and
accident state, which corresponds to unreliability 1 À R, is determined by MTBD
and MTTR. This paper assumes MTBD and MTTR as 30 years and 2 years
respectively. In this model, MTBD and MTTR represents the robustness and the
rapidity of the system.
k ¼ À
1
R
dR
dy
ð22Þ
R ¼ exp Àky
ð
Þ
ð23Þ
f y
ð Þ ¼
d 1 À R
ð
Þ
dy
¼ k exp Àky
ð
Þ
ð24Þ
MTBD ¼
Z
1
0
yf y
ð Þdy ¼
1
k
ð25Þ
296
H. Matsuzawa et al.