

3.2 Congruence and Diversity Distribution
As mentioned previously, if a member agrees to the group’s decision even from
before the discussion, this type of response is called congruence. By comparing IIR
and GR, a score can be assigned to the degree of congruence. Next, by comparing
IIR of members in a same group, a score can be assigned to the degree of diversity.
The calculation is shown by the following formulas (m = ID of participant, i = item
number, g = ID of group where participant m belongs to, p = partner in the same
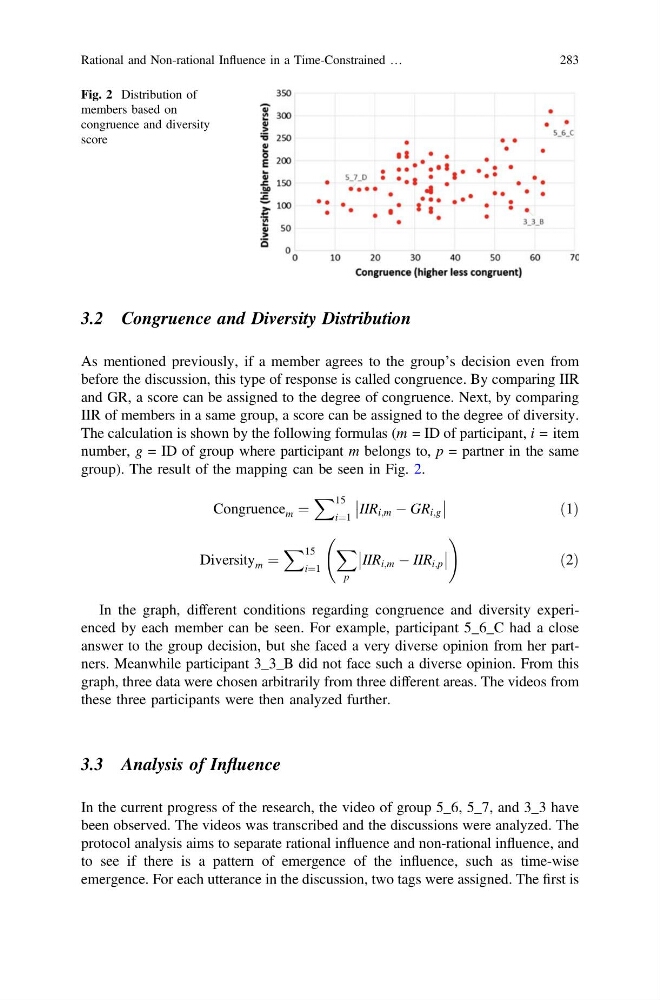
group). The result of the mapping can be seen in Fig. 2.
Congruence m ¼
X 15
i¼1
IIR i;m À GR i;g
ð1Þ
Diversity m ¼
X 15
i¼1
X
p
IIR i;m À IIR i;p
!
ð2Þ
In the graph, different conditions regarding congruence and diversity experienced by each member can be seen. For example, participant 5_6_C had a close
answer to the group decision, but she faced a very diverse opinion from her partners. Meanwhile participant 3_3_B did not face such a diverse opinion. From this
graph, three data were chosen arbitrarily from three different areas. The videos from
these three participants were then analyzed further.
3.3 Analysis of Influence
In the current progress of the research, the video of group 5_6, 5_7, and 3_3 have
been observed. The videos was transcribed and the discussions were analyzed. The
protocol analysis aims to separate rational influence and non-rational influence, and
to see if there is a pattern of emergence of the influence, such as time-wise
emergence. For each utterance in the discussion, two tags were assigned. The first is
Fig. 2 Distribution of
members based on
congruence and diversity
score
Rational and Non-rational Influence in a Time-Constrained …
283
As mentioned previously, if a member agrees to the group’s decision even from
before the discussion, this type of response is called congruence. By comparing IIR
and GR, a score can be assigned to the degree of congruence. Next, by comparing
IIR of members in a same group, a score can be assigned to the degree of diversity.
The calculation is shown by the following formulas (m = ID of participant, i = item
number, g = ID of group where participant m belongs to, p = partner in the same
group). The result of the mapping can be seen in Fig. 2.
Congruence m ¼
X 15
i¼1
IIR i;m À GR i;g
ð1Þ
Diversity m ¼
X 15
i¼1
X
p
IIR i;m À IIR i;p
!
ð2Þ
In the graph, different conditions regarding congruence and diversity experienced by each member can be seen. For example, participant 5_6_C had a close
answer to the group decision, but she faced a very diverse opinion from her partners. Meanwhile participant 3_3_B did not face such a diverse opinion. From this
graph, three data were chosen arbitrarily from three different areas. The videos from
these three participants were then analyzed further.
3.3 Analysis of Influence
In the current progress of the research, the video of group 5_6, 5_7, and 3_3 have
been observed. The videos was transcribed and the discussions were analyzed. The
protocol analysis aims to separate rational influence and non-rational influence, and
to see if there is a pattern of emergence of the influence, such as time-wise
emergence. For each utterance in the discussion, two tags were assigned. The first is
Fig. 2 Distribution of
members based on
congruence and diversity
score
Rational and Non-rational Influence in a Time-Constrained …
283