

7.2 The Physics of Traffic
135
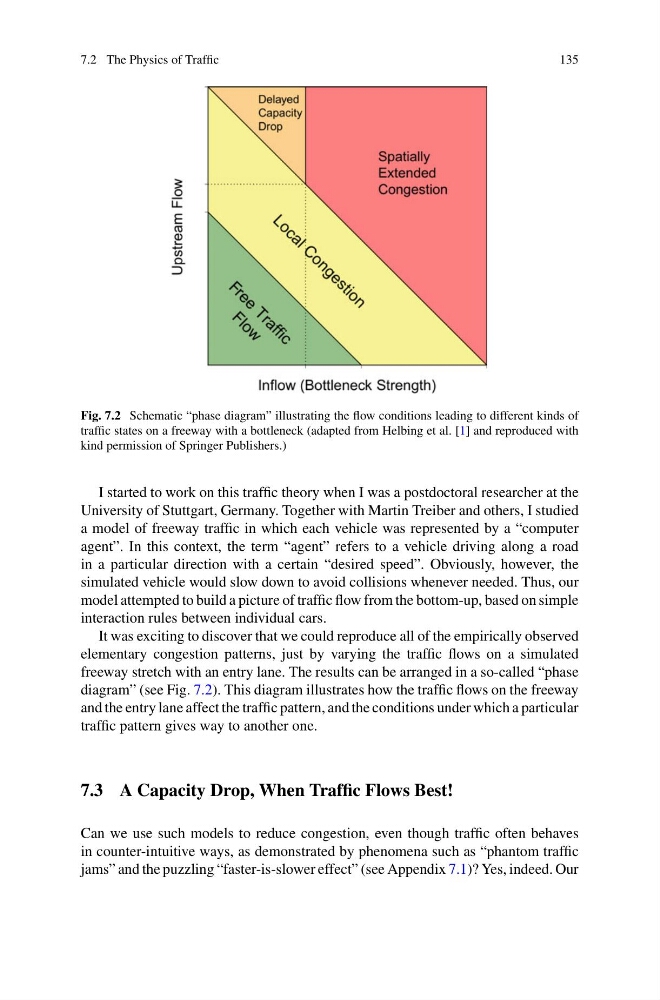
Fig. 7.2 Schematic “phase diagram” illustrating the flow conditions leading to different kinds of
traffic states on a freeway with a bottleneck (adapted from Helbing et al. [1] and reproduced with
kind permission of Springer Publishers.)
I started to work on this traffic theory when I was a postdoctoral researcher at the
University of Stuttgart, Germany. Together with Martin Treiber and others, I studied
a model of freeway traffic in which each vehicle was represented by a “computer
agent”. In this context, the term “agent” refers to a vehicle driving along a road
in a particular direction with a certain “desired speed”. Obviously, however, the
simulated vehicle would slow down to avoid collisions whenever needed. Thus, our
model attempted to build a picture of traffic flow from the bottom-up, based on simple
interaction rules between individual cars.
It was exciting to discover that we could reproduce all of the empirically observed
elementary congestion patterns, just by varying the traffic flows on a simulated
freeway stretch with an entry lane. The results can be arranged in a so-called “phase
diagram” (see Fig. 7.2). This diagram illustrates how the traffic flows on the freeway
and the entry lane affect the traffic pattern, and the conditions under which a particular
traffic pattern gives way to another one.
7.3 A Capacity Drop, When Traffic Flows Best!
Can we use such models to reduce congestion, even though traffic often behaves
in counter-intuitive ways, as demonstrated by phenomena such as “phantom traffic
jams” and the puzzling “faster-is-slower effect” (see Appendix 7.1)? Yes, indeed. Our
135
Fig. 7.2 Schematic “phase diagram” illustrating the flow conditions leading to different kinds of
traffic states on a freeway with a bottleneck (adapted from Helbing et al. [1] and reproduced with
kind permission of Springer Publishers.)
I started to work on this traffic theory when I was a postdoctoral researcher at the
University of Stuttgart, Germany. Together with Martin Treiber and others, I studied
a model of freeway traffic in which each vehicle was represented by a “computer
agent”. In this context, the term “agent” refers to a vehicle driving along a road
in a particular direction with a certain “desired speed”. Obviously, however, the
simulated vehicle would slow down to avoid collisions whenever needed. Thus, our
model attempted to build a picture of traffic flow from the bottom-up, based on simple
interaction rules between individual cars.
It was exciting to discover that we could reproduce all of the empirically observed
elementary congestion patterns, just by varying the traffic flows on a simulated
freeway stretch with an entry lane. The results can be arranged in a so-called “phase
diagram” (see Fig. 7.2). This diagram illustrates how the traffic flows on the freeway
and the entry lane affect the traffic pattern, and the conditions under which a particular
traffic pattern gives way to another one.
7.3 A Capacity Drop, When Traffic Flows Best!
Can we use such models to reduce congestion, even though traffic often behaves
in counter-intuitive ways, as demonstrated by phenomena such as “phantom traffic
jams” and the puzzling “faster-is-slower effect” (see Appendix 7.1)? Yes, indeed. Our