

3 Reduced Phase Models of Oscillatory Neural Networks
47
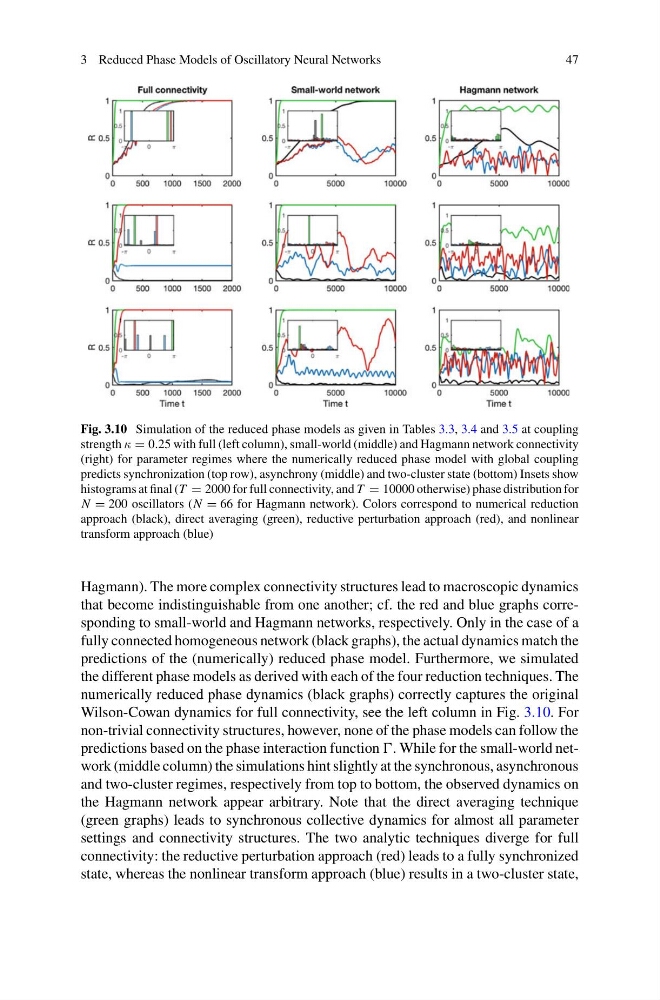
Fig. 3.10 Simulation of the reduced phase models as given in Tables 3.3, 3.4 and 3.5 at coupling
strength κ = 0.25 with full (left column), small-world (middle) and Hagmann network connectivity
(right) for parameter regimes where the numerically reduced phase model with global coupling
predicts synchronization (top row), asynchrony (middle) and two-cluster state (bottom) Insets show
histograms at final (T = 2000 for full connectivity, and T = 10000 otherwise) phase distribution for
N = 200 oscillators (N = 66 for Hagmann network). Colors correspond to numerical reduction
approach (black), direct averaging (green), reductive perturbation approach (red), and nonlinear
transform approach (blue)
Hagmann). The more complex connectivity structures lead to macroscopic dynamics
that become indistinguishable from one another; cf. the red and blue graphs corresponding to small-world and Hagmann networks, respectively. Only in the case of a
fully connected homogeneous network (black graphs), the actual dynamics match the
predictions of the (numerically) reduced phase model. Furthermore, we simulated
the different phase models as derived with each of the four reduction techniques. The
numerically reduced phase dynamics (black graphs) correctly captures the original
Wilson-Cowan dynamics for full connectivity, see the left column in Fig. 3.10. For
non-trivial connectivity structures, however, none of the phase models can follow the
predictions based on the phase interaction function . While for the small-world network (middle column) the simulations hint slightly at the synchronous, asynchronous
and two-cluster regimes, respectively from top to bottom, the observed dynamics on
the Hagmann network appear arbitrary. Note that the direct averaging technique
(green graphs) leads to synchronous collective dynamics for almost all parameter
settings and connectivity structures. The two analytic techniques diverge for full
connectivity: the reductive perturbation approach (red) leads to a fully synchronized
state, whereas the nonlinear transform approach (blue) results in a two-cluster state,
47
Fig. 3.10 Simulation of the reduced phase models as given in Tables 3.3, 3.4 and 3.5 at coupling
strength κ = 0.25 with full (left column), small-world (middle) and Hagmann network connectivity
(right) for parameter regimes where the numerically reduced phase model with global coupling
predicts synchronization (top row), asynchrony (middle) and two-cluster state (bottom) Insets show
histograms at final (T = 2000 for full connectivity, and T = 10000 otherwise) phase distribution for
N = 200 oscillators (N = 66 for Hagmann network). Colors correspond to numerical reduction
approach (black), direct averaging (green), reductive perturbation approach (red), and nonlinear
transform approach (blue)
Hagmann). The more complex connectivity structures lead to macroscopic dynamics
that become indistinguishable from one another; cf. the red and blue graphs corresponding to small-world and Hagmann networks, respectively. Only in the case of a
fully connected homogeneous network (black graphs), the actual dynamics match the
predictions of the (numerically) reduced phase model. Furthermore, we simulated
the different phase models as derived with each of the four reduction techniques. The
numerically reduced phase dynamics (black graphs) correctly captures the original
Wilson-Cowan dynamics for full connectivity, see the left column in Fig. 3.10. For
non-trivial connectivity structures, however, none of the phase models can follow the
predictions based on the phase interaction function . While for the small-world network (middle column) the simulations hint slightly at the synchronous, asynchronous
and two-cluster regimes, respectively from top to bottom, the observed dynamics on
the Hagmann network appear arbitrary. Note that the direct averaging technique
(green graphs) leads to synchronous collective dynamics for almost all parameter
settings and connectivity structures. The two analytic techniques diverge for full
connectivity: the reductive perturbation approach (red) leads to a fully synchronized
state, whereas the nonlinear transform approach (blue) results in a two-cluster state,