

414
Y. A. Abdulhameed et al.
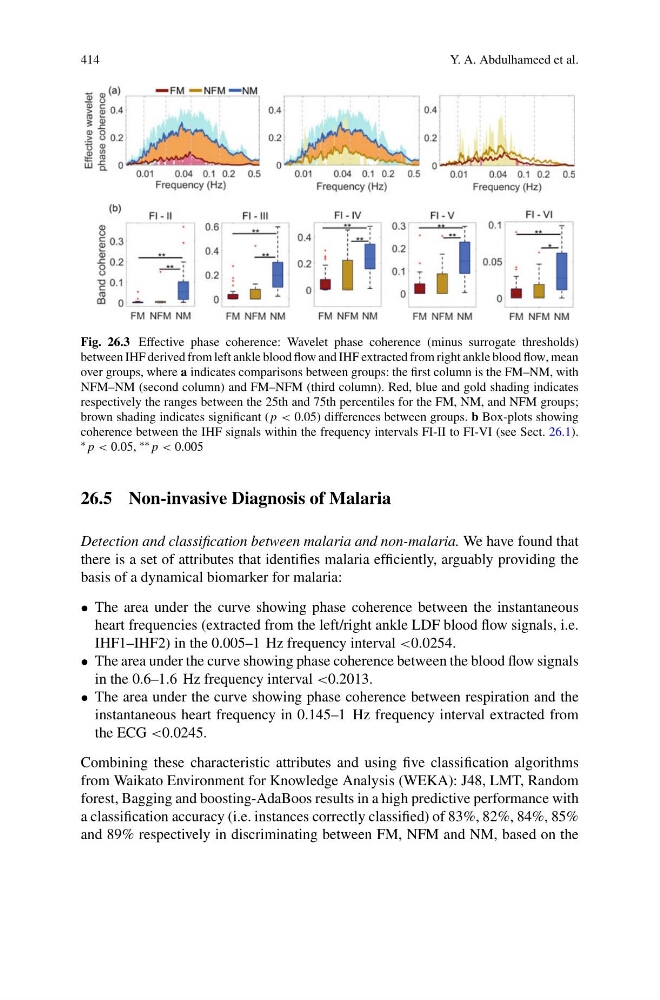
Fig. 26.3 Effective phase coherence: Wavelet phase coherence (minus surrogate thresholds)
between IHF derived from left ankle blood flow and IHF extracted from right ankle blood flow, mean
over groups, where a indicates comparisons between groups: the first column is the FM–NM, with
NFM–NM (second column) and FM–NFM (third column). Red, blue and gold shading indicates
respectively the ranges between the 25th and 75th percentiles for the FM, NM, and NFM groups;
brown shading indicates significant ( p < 0.05) differences between groups. b Box-plots showing
coherence between the IHF signals within the frequency intervals FI-II to FI-VI (see Sect. 26.1).
∗ p < 0.05, ∗∗ p < 0.005
26.5 Non-invasive Diagnosis of Malaria
Detection and classification between malaria and non-malaria. We have found that
there is a set of attributes that identifies malaria efficiently, arguably providing the
basis of a dynamical biomarker for malaria:
• The area under the curve showing phase coherence between the instantaneous
heart frequencies (extracted from the left/right ankle LDF blood flow signals, i.e.
IHF1–IHF2) in the 0.005–1 Hz frequency interval <0.0254.
• The area under the curve showing phase coherence between the blood flow signals
in the 0.6–1.6 Hz frequency interval <0.2013.
• The area under the curve showing phase coherence between respiration and the
instantaneous heart frequency in 0.145–1 Hz frequency interval extracted from
the ECG <0.0245.
Combining these characteristic attributes and using five classification algorithms
from Waikato Environment for Knowledge Analysis (WEKA): J48, LMT, Random
forest, Bagging and boosting-AdaBoos results in a high predictive performance with
a classification accuracy (i.e. instances correctly classified) of 83%, 82%, 84%, 85%
and 89% respectively in discriminating between FM, NFM and NM, based on the
Y. A. Abdulhameed et al.
Fig. 26.3 Effective phase coherence: Wavelet phase coherence (minus surrogate thresholds)
between IHF derived from left ankle blood flow and IHF extracted from right ankle blood flow, mean
over groups, where a indicates comparisons between groups: the first column is the FM–NM, with
NFM–NM (second column) and FM–NFM (third column). Red, blue and gold shading indicates
respectively the ranges between the 25th and 75th percentiles for the FM, NM, and NFM groups;
brown shading indicates significant ( p < 0.05) differences between groups. b Box-plots showing
coherence between the IHF signals within the frequency intervals FI-II to FI-VI (see Sect. 26.1).
∗ p < 0.05, ∗∗ p < 0.005
26.5 Non-invasive Diagnosis of Malaria
Detection and classification between malaria and non-malaria. We have found that
there is a set of attributes that identifies malaria efficiently, arguably providing the
basis of a dynamical biomarker for malaria:
• The area under the curve showing phase coherence between the instantaneous
heart frequencies (extracted from the left/right ankle LDF blood flow signals, i.e.
IHF1–IHF2) in the 0.005–1 Hz frequency interval <0.0254.
• The area under the curve showing phase coherence between the blood flow signals
in the 0.6–1.6 Hz frequency interval <0.2013.
• The area under the curve showing phase coherence between respiration and the
instantaneous heart frequency in 0.145–1 Hz frequency interval extracted from
the ECG <0.0245.
Combining these characteristic attributes and using five classification algorithms
from Waikato Environment for Knowledge Analysis (WEKA): J48, LMT, Random
forest, Bagging and boosting-AdaBoos results in a high predictive performance with
a classification accuracy (i.e. instances correctly classified) of 83%, 82%, 84%, 85%
and 89% respectively in discriminating between FM, NFM and NM, based on the