

20 Sleep-Related Modulations of Heart Rate Variability…
313
added in the 1980’s, coining the term cardio-respiratory polysomnography. However,
respiration as recorded during sleep needs a longer time window to be evaluated as
depicted in Fig. 20.1b. Only with the help of cardio-respiratory polysomnography,
sleep apneas could be detected and classified into obstructive sleep apnea (OSA)
and central sleep apnea (CSA) (Fig. 20.2). Nowadays, PSGs containing all these
raw data are recorded in hundreds of sleep centers worldwide. The matured discipline of sleep medicine trains sleep physicians and sleep scientists to diagnose all
the different kinds of sleep disorders based on their PSG characteristics as well as
clinical symptoms and consequences.
The cardiac component of cardio-respiratory polysomnography is covered by
electrocardiography (ECG) and heart rate recordings. However, cardio-respiratory
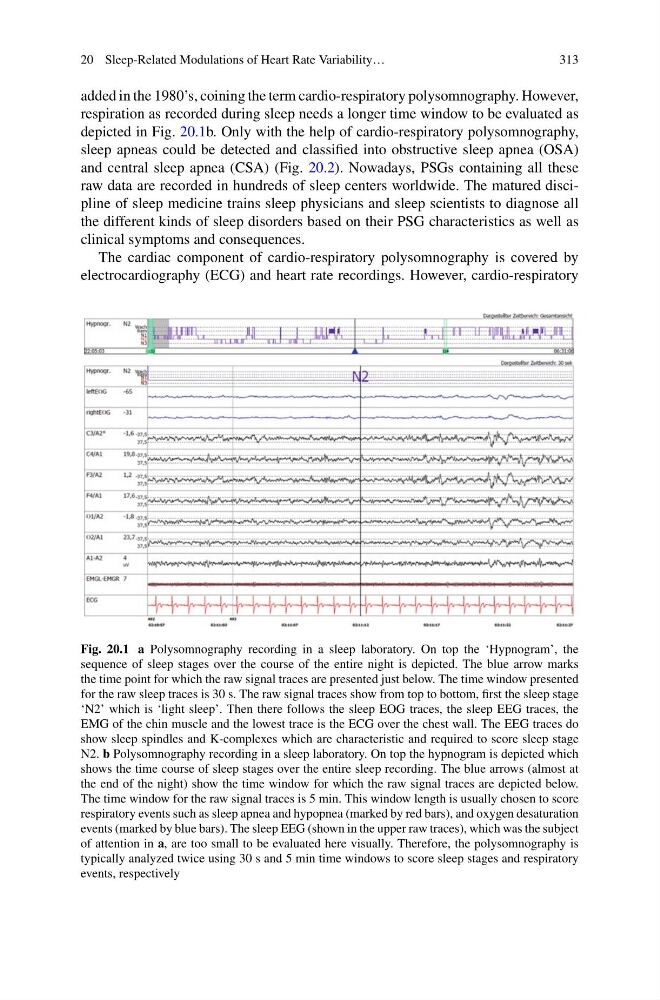
Fig. 20.1 a Polysomnography recording in a sleep laboratory. On top the ‘Hypnogram’, the
sequence of sleep stages over the course of the entire night is depicted. The blue arrow marks
the time point for which the raw signal traces are presented just below. The time window presented
for the raw sleep traces is 30 s. The raw signal traces show from top to bottom, first the sleep stage
‘N2’ which is ‘light sleep’. Then there follows the sleep EOG traces, the sleep EEG traces, the
EMG of the chin muscle and the lowest trace is the ECG over the chest wall. The EEG traces do
show sleep spindles and K-complexes which are characteristic and required to score sleep stage
N2. b Polysomnography recording in a sleep laboratory. On top the hypnogram is depicted which
shows the time course of sleep stages over the entire sleep recording. The blue arrows (almost at
the end of the night) show the time window for which the raw signal traces are depicted below.
The time window for the raw signal traces is 5 min. This window length is usually chosen to score
respiratory events such as sleep apnea and hypopnea (marked by red bars), and oxygen desaturation
events (marked by blue bars). The sleep EEG (shown in the upper raw traces), which was the subject
of attention in a, are too small to be evaluated here visually. Therefore, the polysomnography is
typically analyzed twice using 30 s and 5 min time windows to score sleep stages and respiratory
events, respectively
313
added in the 1980’s, coining the term cardio-respiratory polysomnography. However,
respiration as recorded during sleep needs a longer time window to be evaluated as
depicted in Fig. 20.1b. Only with the help of cardio-respiratory polysomnography,
sleep apneas could be detected and classified into obstructive sleep apnea (OSA)
and central sleep apnea (CSA) (Fig. 20.2). Nowadays, PSGs containing all these
raw data are recorded in hundreds of sleep centers worldwide. The matured discipline of sleep medicine trains sleep physicians and sleep scientists to diagnose all
the different kinds of sleep disorders based on their PSG characteristics as well as
clinical symptoms and consequences.
The cardiac component of cardio-respiratory polysomnography is covered by
electrocardiography (ECG) and heart rate recordings. However, cardio-respiratory
Fig. 20.1 a Polysomnography recording in a sleep laboratory. On top the ‘Hypnogram’, the
sequence of sleep stages over the course of the entire night is depicted. The blue arrow marks
the time point for which the raw signal traces are presented just below. The time window presented
for the raw sleep traces is 30 s. The raw signal traces show from top to bottom, first the sleep stage
‘N2’ which is ‘light sleep’. Then there follows the sleep EOG traces, the sleep EEG traces, the
EMG of the chin muscle and the lowest trace is the ECG over the chest wall. The EEG traces do
show sleep spindles and K-complexes which are characteristic and required to score sleep stage
N2. b Polysomnography recording in a sleep laboratory. On top the hypnogram is depicted which
shows the time course of sleep stages over the entire sleep recording. The blue arrows (almost at
the end of the night) show the time window for which the raw signal traces are depicted below.
The time window for the raw signal traces is 5 min. This window length is usually chosen to score
respiratory events such as sleep apnea and hypopnea (marked by red bars), and oxygen desaturation
events (marked by blue bars). The sleep EEG (shown in the upper raw traces), which was the subject
of attention in a, are too small to be evaluated here visually. Therefore, the polysomnography is
typically analyzed twice using 30 s and 5 min time windows to score sleep stages and respiratory
events, respectively