

19 Complexity-Based Analysis of Microvascular Blood …
305
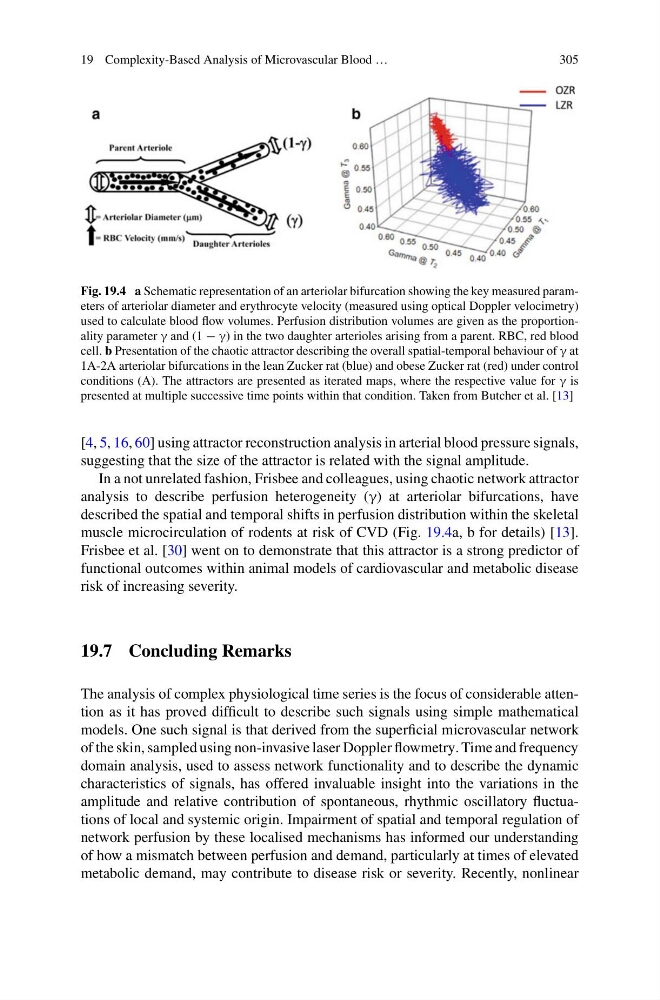
Fig. 19.4 a Schematic representation of an arteriolar bifurcation showing the key measured parameters of arteriolar diameter and erythrocyte velocity (measured using optical Doppler velocimetry)
used to calculate blood flow volumes. Perfusion distribution volumes are given as the proportionality parameter γ and (1 − γ) in the two daughter arterioles arising from a parent. RBC, red blood
cell. b Presentation of the chaotic attractor describing the overall spatial-temporal behaviour of γ at
1A-2A arteriolar bifurcations in the lean Zucker rat (blue) and obese Zucker rat (red) under control
conditions (A). The attractors are presented as iterated maps, where the respective value for γ is
presented at multiple successive time points within that condition. Taken from Butcher et al. [13]
[4, 5, 16, 60] using attractor reconstruction analysis in arterial blood pressure signals,
suggesting that the size of the attractor is related with the signal amplitude.
In a not unrelated fashion, Frisbee and colleagues, using chaotic network attractor
analysis to describe perfusion heterogeneity (γ) at arteriolar bifurcations, have
described the spatial and temporal shifts in perfusion distribution within the skeletal
muscle microcirculation of rodents at risk of CVD (Fig. 19.4a, b for details) [13].
Frisbee et al. [30] went on to demonstrate that this attractor is a strong predictor of
functional outcomes within animal models of cardiovascular and metabolic disease
risk of increasing severity.
19.7 Concluding Remarks
The analysis of complex physiological time series is the focus of considerable attention as it has proved difficult to describe such signals using simple mathematical
models. One such signal is that derived from the superficial microvascular network
of the skin, sampled using non-invasive laser Doppler flowmetry. Time and frequency
domain analysis, used to assess network functionality and to describe the dynamic
characteristics of signals, has offered invaluable insight into the variations in the
amplitude and relative contribution of spontaneous, rhythmic oscillatory fluctuations of local and systemic origin. Impairment of spatial and temporal regulation of
network perfusion by these localised mechanisms has informed our understanding
of how a mismatch between perfusion and demand, particularly at times of elevated
metabolic demand, may contribute to disease risk or severity. Recently, nonlinear
305
Fig. 19.4 a Schematic representation of an arteriolar bifurcation showing the key measured parameters of arteriolar diameter and erythrocyte velocity (measured using optical Doppler velocimetry)
used to calculate blood flow volumes. Perfusion distribution volumes are given as the proportionality parameter γ and (1 − γ) in the two daughter arterioles arising from a parent. RBC, red blood
cell. b Presentation of the chaotic attractor describing the overall spatial-temporal behaviour of γ at
1A-2A arteriolar bifurcations in the lean Zucker rat (blue) and obese Zucker rat (red) under control
conditions (A). The attractors are presented as iterated maps, where the respective value for γ is
presented at multiple successive time points within that condition. Taken from Butcher et al. [13]
[4, 5, 16, 60] using attractor reconstruction analysis in arterial blood pressure signals,
suggesting that the size of the attractor is related with the signal amplitude.
In a not unrelated fashion, Frisbee and colleagues, using chaotic network attractor
analysis to describe perfusion heterogeneity (γ) at arteriolar bifurcations, have
described the spatial and temporal shifts in perfusion distribution within the skeletal
muscle microcirculation of rodents at risk of CVD (Fig. 19.4a, b for details) [13].
Frisbee et al. [30] went on to demonstrate that this attractor is a strong predictor of
functional outcomes within animal models of cardiovascular and metabolic disease
risk of increasing severity.
19.7 Concluding Remarks
The analysis of complex physiological time series is the focus of considerable attention as it has proved difficult to describe such signals using simple mathematical
models. One such signal is that derived from the superficial microvascular network
of the skin, sampled using non-invasive laser Doppler flowmetry. Time and frequency
domain analysis, used to assess network functionality and to describe the dynamic
characteristics of signals, has offered invaluable insight into the variations in the
amplitude and relative contribution of spontaneous, rhythmic oscillatory fluctuations of local and systemic origin. Impairment of spatial and temporal regulation of
network perfusion by these localised mechanisms has informed our understanding
of how a mismatch between perfusion and demand, particularly at times of elevated
metabolic demand, may contribute to disease risk or severity. Recently, nonlinear