

304
M. Thanaj et al.
found that nonlinear features derived from the attractors were able to detect the
changes in the cerebral blood flow during apnoea.
LDF BF signals are also quasi-periodic and quasi-stationary and may also lend
themselves to the attractor reconstruction method as a potential method by which
to identify changes in the microvascular functionality. Thanaj et al. [84] showed a
significant drop of the maximal density derived from the ARA, during increased
flow, with a good discrimination of the blood flow signals between two functional
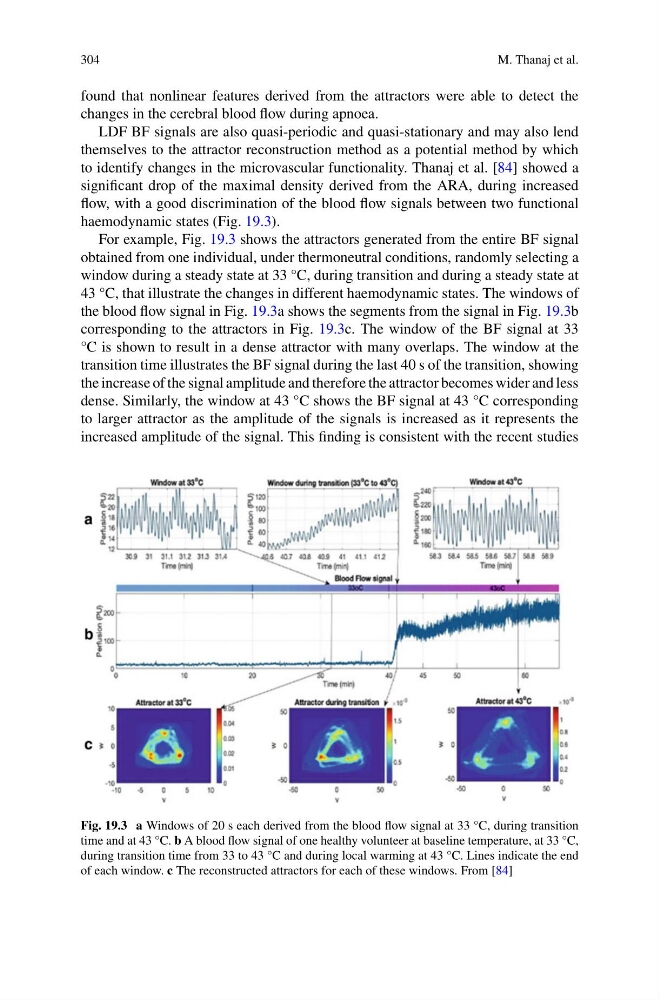
haemodynamic states (Fig. 19.3).
For example, Fig. 19.3 shows the attractors generated from the entire BF signal
obtained from one individual, under thermoneutral conditions, randomly selecting a
window during a steady state at 33 °C, during transition and during a steady state at
43 °C, that illustrate the changes in different haemodynamic states. The windows of
the blood flow signal in Fig. 19.3a shows the segments from the signal in Fig. 19.3b
corresponding to the attractors in Fig. 19.3c. The window of the BF signal at 33
°C is shown to result in a dense attractor with many overlaps. The window at the
transition time illustrates the BF signal during the last 40 s of the transition, showing
the increase of the signal amplitude and therefore the attractor becomes wider and less
dense. Similarly, the window at 43 °C shows the BF signal at 43 °C corresponding
to larger attractor as the amplitude of the signals is increased as it represents the
increased amplitude of the signal. This finding is consistent with the recent studies
Fig. 19.3 a Windows of 20 s each derived from the blood flow signal at 33 °C, during transition
time and at 43 °C. b A blood flow signal of one healthy volunteer at baseline temperature, at 33 °C,
during transition time from 33 to 43 °C and during local warming at 43 °C. Lines indicate the end
of each window. c The reconstructed attractors for each of these windows. From [84]
M. Thanaj et al.
found that nonlinear features derived from the attractors were able to detect the
changes in the cerebral blood flow during apnoea.
LDF BF signals are also quasi-periodic and quasi-stationary and may also lend
themselves to the attractor reconstruction method as a potential method by which
to identify changes in the microvascular functionality. Thanaj et al. [84] showed a
significant drop of the maximal density derived from the ARA, during increased
flow, with a good discrimination of the blood flow signals between two functional
haemodynamic states (Fig. 19.3).
For example, Fig. 19.3 shows the attractors generated from the entire BF signal
obtained from one individual, under thermoneutral conditions, randomly selecting a
window during a steady state at 33 °C, during transition and during a steady state at
43 °C, that illustrate the changes in different haemodynamic states. The windows of
the blood flow signal in Fig. 19.3a shows the segments from the signal in Fig. 19.3b
corresponding to the attractors in Fig. 19.3c. The window of the BF signal at 33
°C is shown to result in a dense attractor with many overlaps. The window at the
transition time illustrates the BF signal during the last 40 s of the transition, showing
the increase of the signal amplitude and therefore the attractor becomes wider and less
dense. Similarly, the window at 43 °C shows the BF signal at 43 °C corresponding
to larger attractor as the amplitude of the signals is increased as it represents the
increased amplitude of the signal. This finding is consistent with the recent studies
Fig. 19.3 a Windows of 20 s each derived from the blood flow signal at 33 °C, during transition
time and at 43 °C. b A blood flow signal of one healthy volunteer at baseline temperature, at 33 °C,
during transition time from 33 to 43 °C and during local warming at 43 °C. Lines indicate the end
of each window. c The reconstructed attractors for each of these windows. From [84]