

15 Glycolytic Oscillations in Cancer Cells
249
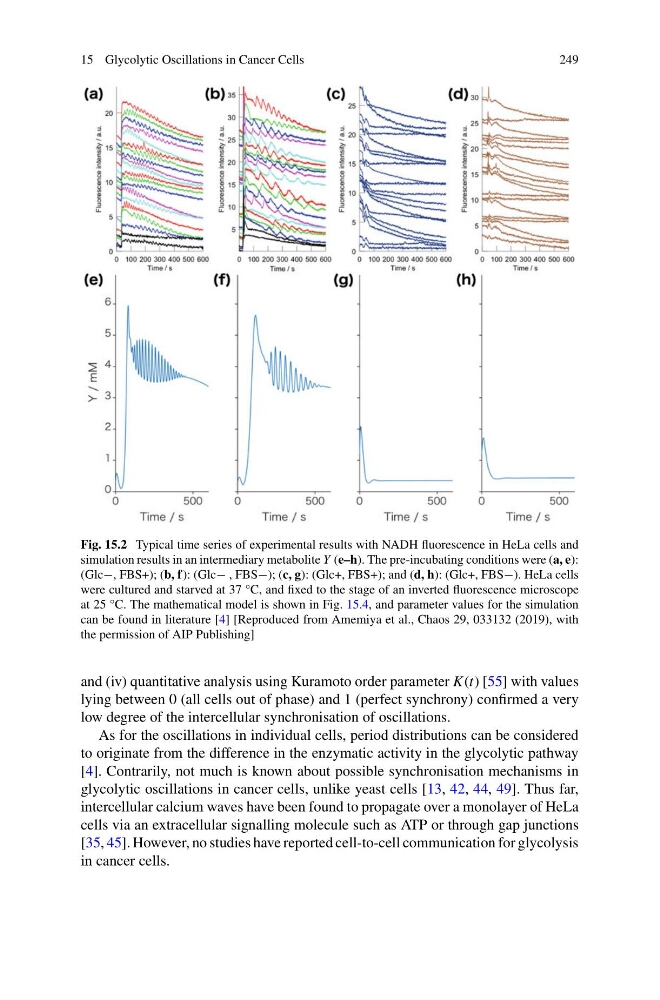
Fig. 15.2 Typical time series of experimental results with NADH fluorescence in HeLa cells and
simulation results in an intermediary metabolite Y (e–h). The pre-incubating conditions were (a, e):
(Glc−, FBS+); (b, f): (Glc− , FBS−); (c, g): (Glc+, FBS+); and (d, h): (Glc+, FBS−). HeLa cells
were cultured and starved at 37 °C, and fixed to the stage of an inverted fluorescence microscope
at 25 °C. The mathematical model is shown in Fig. 15.4, and parameter values for the simulation
can be found in literature [4] [Reproduced from Amemiya et al., Chaos 29, 033132 (2019), with
the permission of AIP Publishing]
and (iv) quantitative analysis using Kuramoto order parameter K(t) [55] with values
lying between 0 (all cells out of phase) and 1 (perfect synchrony) confirmed a very
low degree of the intercellular synchronisation of oscillations.
As for the oscillations in individual cells, period distributions can be considered
to originate from the difference in the enzymatic activity in the glycolytic pathway
[4]. Contrarily, not much is known about possible synchronisation mechanisms in
glycolytic oscillations in cancer cells, unlike yeast cells [13, 42, 44, 49]. Thus far,
intercellular calcium waves have been found to propagate over a monolayer of HeLa
cells via an extracellular signalling molecule such as ATP or through gap junctions
[35, 45]. However, no studies have reported cell-to-cell communication for glycolysis
in cancer cells.
249
Fig. 15.2 Typical time series of experimental results with NADH fluorescence in HeLa cells and
simulation results in an intermediary metabolite Y (e–h). The pre-incubating conditions were (a, e):
(Glc−, FBS+); (b, f): (Glc− , FBS−); (c, g): (Glc+, FBS+); and (d, h): (Glc+, FBS−). HeLa cells
were cultured and starved at 37 °C, and fixed to the stage of an inverted fluorescence microscope
at 25 °C. The mathematical model is shown in Fig. 15.4, and parameter values for the simulation
can be found in literature [4] [Reproduced from Amemiya et al., Chaos 29, 033132 (2019), with
the permission of AIP Publishing]
and (iv) quantitative analysis using Kuramoto order parameter K(t) [55] with values
lying between 0 (all cells out of phase) and 1 (perfect synchrony) confirmed a very
low degree of the intercellular synchronisation of oscillations.
As for the oscillations in individual cells, period distributions can be considered
to originate from the difference in the enzymatic activity in the glycolytic pathway
[4]. Contrarily, not much is known about possible synchronisation mechanisms in
glycolytic oscillations in cancer cells, unlike yeast cells [13, 42, 44, 49]. Thus far,
intercellular calcium waves have been found to propagate over a monolayer of HeLa
cells via an extracellular signalling molecule such as ATP or through gap junctions
[35, 45]. However, no studies have reported cell-to-cell communication for glycolysis
in cancer cells.