

13 Oscillations in Yeast Glycolysis
217
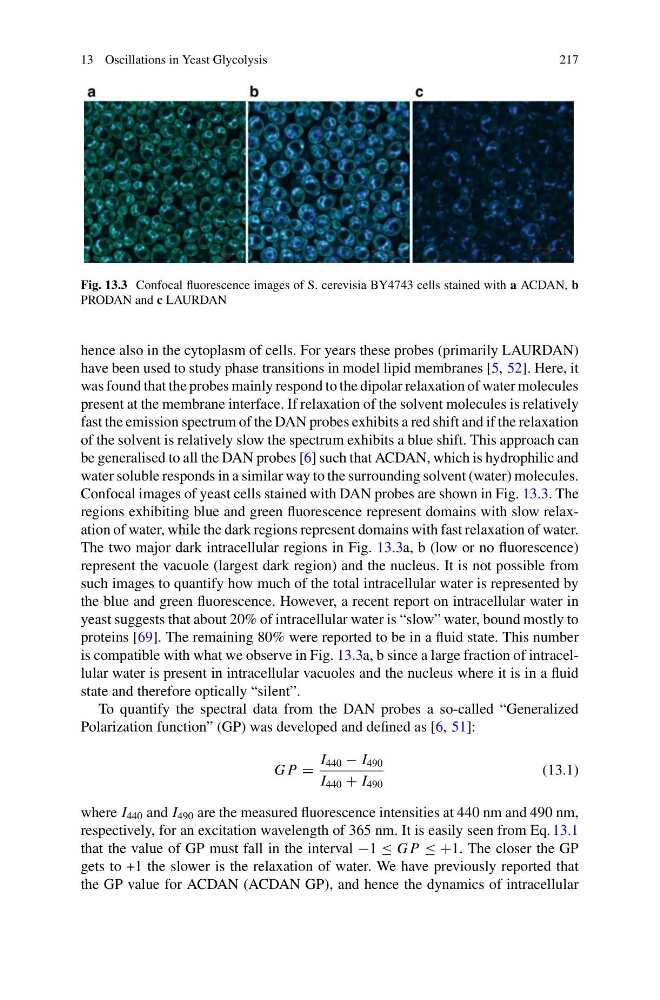
Fig. 13.3 Confocal fluorescence images of S. cerevisia BY4743 cells stained with a ACDAN, b
PRODAN and c LAURDAN
hence also in the cytoplasm of cells. For years these probes (primarily LAURDAN)
have been used to study phase transitions in model lipid membranes [5, 52]. Here, it
was found that the probes mainly respond to the dipolar relaxation of water molecules
present at the membrane interface. If relaxation of the solvent molecules is relatively
fast the emission spectrum of the DAN probes exhibits a red shift and if the relaxation
of the solvent is relatively slow the spectrum exhibits a blue shift. This approach can
be generalised to all the DAN probes [6] such that ACDAN, which is hydrophilic and
water soluble responds in a similar way to the surrounding solvent (water) molecules.
Confocal images of yeast cells stained with DAN probes are shown in Fig. 13.3. The
regions exhibiting blue and green fluorescence represent domains with slow relaxation of water, while the dark regions represent domains with fast relaxation of water.
The two major dark intracellular regions in Fig. 13.3a, b (low or no fluorescence)
represent the vacuole (largest dark region) and the nucleus. It is not possible from
such images to quantify how much of the total intracellular water is represented by
the blue and green fluorescence. However, a recent report on intracellular water in
yeast suggests that about 20% of intracellular water is “slow” water, bound mostly to
proteins [69]. The remaining 80% were reported to be in a fluid state. This number
is compatible with what we observe in Fig. 13.3a, b since a large fraction of intracellular water is present in intracellular vacuoles and the nucleus where it is in a fluid
state and therefore optically “silent”.
To quantify the spectral data from the DAN probes a so-called “Generalized
Polarization function” (GP) was developed and defined as [6, 51]:
G P =
I 440 − I 490
I 440 + I 490
(13.1)
where I 440 and I 490 are the measured fluorescence intensities at 440 nm and 490 nm,
respectively, for an excitation wavelength of 365 nm. It is easily seen from Eq. 13.1
that the value of GP must fall in the interval −1 ≤ G P ≤ +1. The closer the GP
gets to +1 the slower is the relaxation of water. We have previously reported that
the GP value for ACDAN (ACDAN GP), and hence the dynamics of intracellular
217
Fig. 13.3 Confocal fluorescence images of S. cerevisia BY4743 cells stained with a ACDAN, b
PRODAN and c LAURDAN
hence also in the cytoplasm of cells. For years these probes (primarily LAURDAN)
have been used to study phase transitions in model lipid membranes [5, 52]. Here, it
was found that the probes mainly respond to the dipolar relaxation of water molecules
present at the membrane interface. If relaxation of the solvent molecules is relatively
fast the emission spectrum of the DAN probes exhibits a red shift and if the relaxation
of the solvent is relatively slow the spectrum exhibits a blue shift. This approach can
be generalised to all the DAN probes [6] such that ACDAN, which is hydrophilic and
water soluble responds in a similar way to the surrounding solvent (water) molecules.
Confocal images of yeast cells stained with DAN probes are shown in Fig. 13.3. The
regions exhibiting blue and green fluorescence represent domains with slow relaxation of water, while the dark regions represent domains with fast relaxation of water.
The two major dark intracellular regions in Fig. 13.3a, b (low or no fluorescence)
represent the vacuole (largest dark region) and the nucleus. It is not possible from
such images to quantify how much of the total intracellular water is represented by
the blue and green fluorescence. However, a recent report on intracellular water in
yeast suggests that about 20% of intracellular water is “slow” water, bound mostly to
proteins [69]. The remaining 80% were reported to be in a fluid state. This number
is compatible with what we observe in Fig. 13.3a, b since a large fraction of intracellular water is present in intracellular vacuoles and the nucleus where it is in a fluid
state and therefore optically “silent”.
To quantify the spectral data from the DAN probes a so-called “Generalized
Polarization function” (GP) was developed and defined as [6, 51]:
G P =
I 440 − I 490
I 440 + I 490
(13.1)
where I 440 and I 490 are the measured fluorescence intensities at 440 nm and 490 nm,
respectively, for an excitation wavelength of 365 nm. It is easily seen from Eq. 13.1
that the value of GP must fall in the interval −1 ≤ G P ≤ +1. The closer the GP
gets to +1 the slower is the relaxation of water. We have previously reported that
the GP value for ACDAN (ACDAN GP), and hence the dynamics of intracellular