

214
L. F. Olsen and A. Lunding
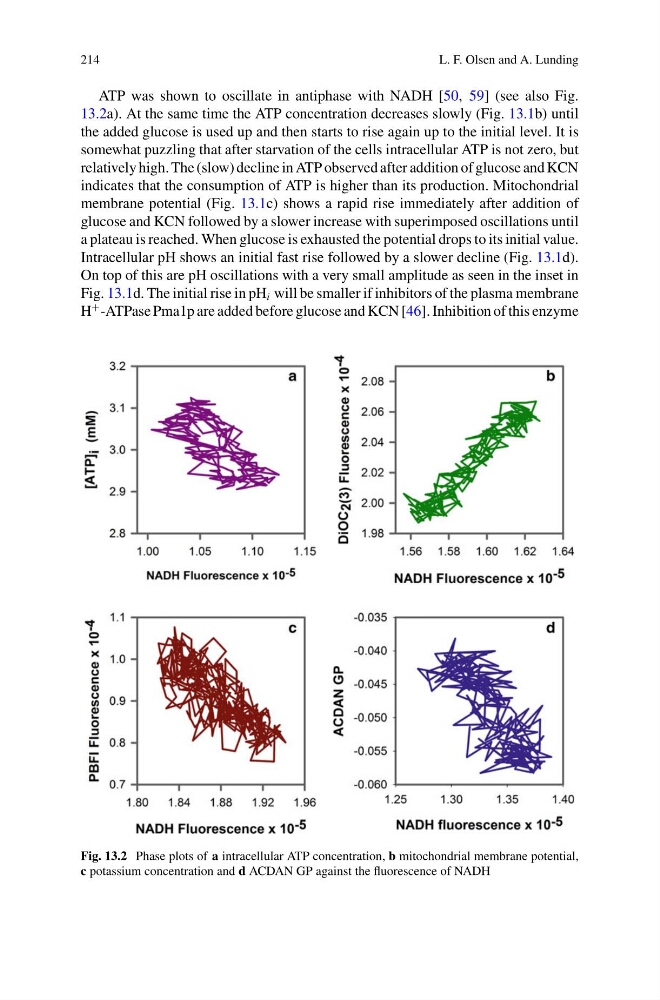
ATP was shown to oscillate in antiphase with NADH [50, 59] (see also Fig.
13.2a). At the same time the ATP concentration decreases slowly (Fig. 13.1b) until
the added glucose is used up and then starts to rise again up to the initial level. It is
somewhat puzzling that after starvation of the cells intracellular ATP is not zero, but
relatively high. The (slow) decline in ATP observed after addition of glucose and KCN
indicates that the consumption of ATP is higher than its production. Mitochondrial
membrane potential (Fig. 13.1c) shows a rapid rise immediately after addition of
glucose and KCN followed by a slower increase with superimposed oscillations until
a plateau is reached. When glucose is exhausted the potential drops to its initial value.
Intracellular pH shows an initial fast rise followed by a slower decline (Fig. 13.1d).
On top of this are pH oscillations with a very small amplitude as seen in the inset in
Fig. 13.1d. The initial rise in pH i will be smaller if inhibitors of the plasma membrane
H
+ -ATPase Pma1p are added before glucose and KCN [46]. Inhibition of this enzyme
Fig. 13.2 Phase plots of a intracellular ATP concentration, b mitochondrial membrane potential,
c potassium concentration and d ACDAN GP against the fluorescence of NADH
L. F. Olsen and A. Lunding
ATP was shown to oscillate in antiphase with NADH [50, 59] (see also Fig.
13.2a). At the same time the ATP concentration decreases slowly (Fig. 13.1b) until
the added glucose is used up and then starts to rise again up to the initial level. It is
somewhat puzzling that after starvation of the cells intracellular ATP is not zero, but
relatively high. The (slow) decline in ATP observed after addition of glucose and KCN
indicates that the consumption of ATP is higher than its production. Mitochondrial
membrane potential (Fig. 13.1c) shows a rapid rise immediately after addition of
glucose and KCN followed by a slower increase with superimposed oscillations until
a plateau is reached. When glucose is exhausted the potential drops to its initial value.
Intracellular pH shows an initial fast rise followed by a slower decline (Fig. 13.1d).
On top of this are pH oscillations with a very small amplitude as seen in the inset in
Fig. 13.1d. The initial rise in pH i will be smaller if inhibitors of the plasma membrane
H
+ -ATPase Pma1p are added before glucose and KCN [46]. Inhibition of this enzyme
Fig. 13.2 Phase plots of a intracellular ATP concentration, b mitochondrial membrane potential,
c potassium concentration and d ACDAN GP against the fluorescence of NADH