

13 Oscillations in Yeast Glycolysis
213
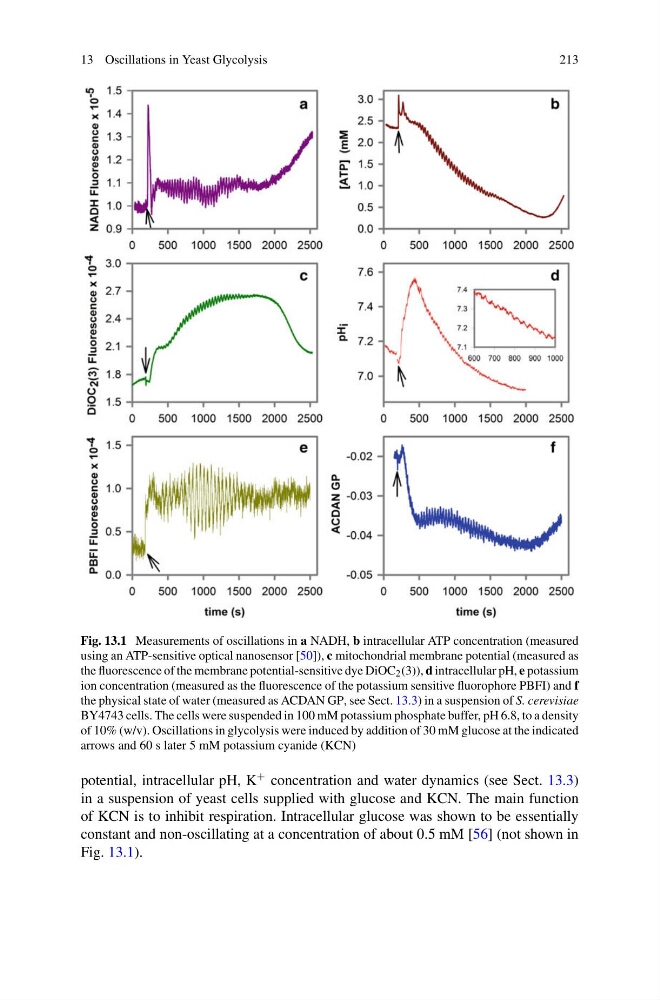
Fig. 13.1 Measurements of oscillations in a NADH, b intracellular ATP concentration (measured
using an ATP-sensitive optical nanosensor [50]), c mitochondrial membrane potential (measured as
the fluorescence of the membrane potential-sensitive dye DiOC 2 (3)), d intracellular pH, e potassium
ion concentration (measured as the fluorescence of the potassium sensitive fluorophore PBFI) and f
the physical state of water (measured as ACDAN GP, see Sect. 13.3) in a suspension of S. cerevisiae
BY4743 cells. The cells were suspended in 100 mM potassium phosphate buffer, pH 6.8, to a density
of 10% (w/v). Oscillations in glycolysis were induced by addition of 30 mM glucose at the indicated
arrows and 60 s later 5 mM potassium cyanide (KCN)
potential, intracellular pH, K
+ concentration and water dynamics (see Sect. 13.3)
in a suspension of yeast cells supplied with glucose and KCN. The main function
of KCN is to inhibit respiration. Intracellular glucose was shown to be essentially
constant and non-oscillating at a concentration of about 0.5 mM [56] (not shown in
Fig. 13.1).
213
Fig. 13.1 Measurements of oscillations in a NADH, b intracellular ATP concentration (measured
using an ATP-sensitive optical nanosensor [50]), c mitochondrial membrane potential (measured as
the fluorescence of the membrane potential-sensitive dye DiOC 2 (3)), d intracellular pH, e potassium
ion concentration (measured as the fluorescence of the potassium sensitive fluorophore PBFI) and f
the physical state of water (measured as ACDAN GP, see Sect. 13.3) in a suspension of S. cerevisiae
BY4743 cells. The cells were suspended in 100 mM potassium phosphate buffer, pH 6.8, to a density
of 10% (w/v). Oscillations in glycolysis were induced by addition of 30 mM glucose at the indicated
arrows and 60 s later 5 mM potassium cyanide (KCN)
potential, intracellular pH, K
+ concentration and water dynamics (see Sect. 13.3)
in a suspension of yeast cells supplied with glucose and KCN. The main function
of KCN is to inhibit respiration. Intracellular glucose was shown to be essentially
constant and non-oscillating at a concentration of about 0.5 mM [56] (not shown in
Fig. 13.1).