

200
E. Gengel and A. Pikovsky
0
π
2π
0
π
2π 0
π
2π
θ
1,10 (ϕ),ψ
10 (ϕ)
ϕ
ϕ
(a)
(b)
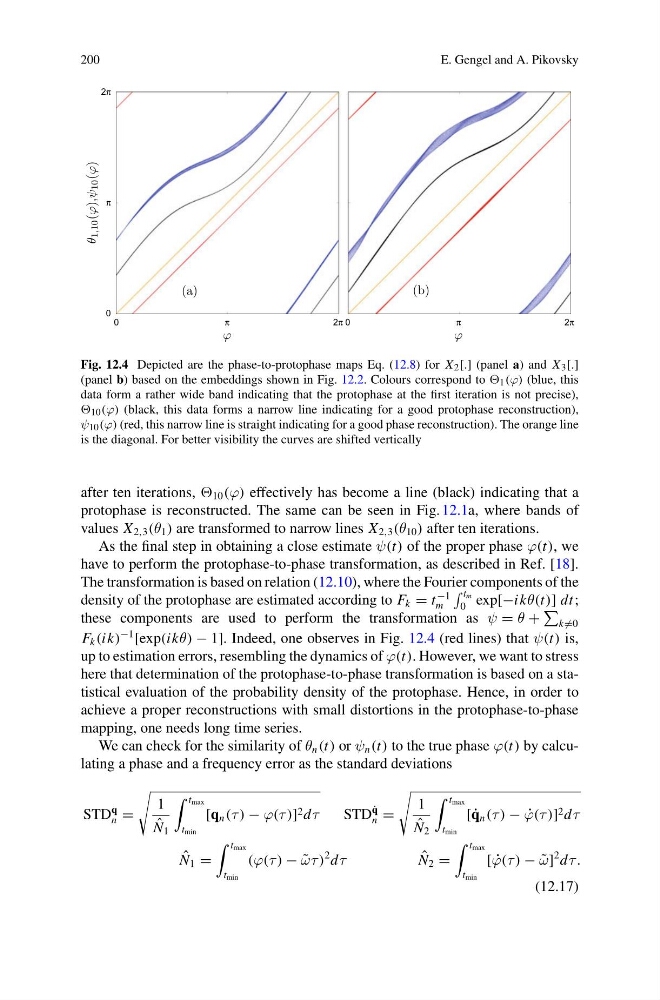
Fig. 12.4 Depicted are the phase-to-protophase maps Eq. (12.8) for X 2 [.] (panel a) and X 3 [.]
(panel b) based on the embeddings shown in Fig. 12.2. Colours correspond to 1 (ϕ) (blue, this
data form a rather wide band indicating that the protophase at the first iteration is not precise),
10 (ϕ) (black, this data forms a narrow line indicating for a good protophase reconstruction),
ψ 10 (ϕ) (red, this narrow line is straight indicating for a good phase reconstruction). The orange line
is the diagonal. For better visibility the curves are shifted vertically
after ten iterations, 10 (ϕ) effectively has become a line (black) indicating that a
protophase is reconstructed. The same can be seen in Fig. 12.1a, where bands of
values X 2,3 (θ 1 ) are transformed to narrow lines X 2,3 (θ 10 ) after ten iterations.
As the final step in obtaining a close estimate ψ(t) of the proper phase ϕ(t), we
have to perform the protophase-to-phase transformation, as described in Ref. [18].
The transformation is based on relation (12.10), where the Fourier components of the
density of the protophase are estimated according to F k = t
−1
m
t m
0 exp[−ikθ(t)] dt;
these components are used to perform the transformation as ψ = θ +
k =0
F k (ik)
−1
[exp(ikθ) − 1]. Indeed, one observes in Fig. 12.4 (red lines) that ψ(t) is,
up to estimation errors, resembling the dynamics of ϕ(t). However, we want to stress
here that determination of the protophase-to-phase transformation is based on a statistical evaluation of the probability density of the protophase. Hence, in order to
achieve a proper reconstructions with small distortions in the protophase-to-phase
mapping, one needs long time series.
We can check for the similarity of θ n (t) or ψ n (t) to the true phase ϕ(t) by calculating a phase and a frequency error as the standard deviations
STD
q
n =
1
ˆ
N 1
t max
t min
[q n (τ ) − ϕ(τ )] 2 dτ
STD
˙
q
n =
1
ˆ
N 2
t max
t min
[ ˙
q n (τ ) − ˙
ϕ(τ )] 2 dτ
ˆ
N 1 =
t max
t min
(ϕ(τ ) − ˜
ωτ )
2 dτ
ˆ
N 2 =
t max
t min
[ ˙
ϕ(τ ) − ˜
ω]
2 dτ .
(12.17)
E. Gengel and A. Pikovsky
0
π
2π
0
π
2π 0
π
2π
θ
1,10 (ϕ),ψ
10 (ϕ)
ϕ
ϕ
(a)
(b)
Fig. 12.4 Depicted are the phase-to-protophase maps Eq. (12.8) for X 2 [.] (panel a) and X 3 [.]
(panel b) based on the embeddings shown in Fig. 12.2. Colours correspond to 1 (ϕ) (blue, this
data form a rather wide band indicating that the protophase at the first iteration is not precise),
10 (ϕ) (black, this data forms a narrow line indicating for a good protophase reconstruction),
ψ 10 (ϕ) (red, this narrow line is straight indicating for a good phase reconstruction). The orange line
is the diagonal. For better visibility the curves are shifted vertically
after ten iterations, 10 (ϕ) effectively has become a line (black) indicating that a
protophase is reconstructed. The same can be seen in Fig. 12.1a, where bands of
values X 2,3 (θ 1 ) are transformed to narrow lines X 2,3 (θ 10 ) after ten iterations.
As the final step in obtaining a close estimate ψ(t) of the proper phase ϕ(t), we
have to perform the protophase-to-phase transformation, as described in Ref. [18].
The transformation is based on relation (12.10), where the Fourier components of the
density of the protophase are estimated according to F k = t
−1
m
t m
0 exp[−ikθ(t)] dt;
these components are used to perform the transformation as ψ = θ +
k =0
F k (ik)
−1
[exp(ikθ) − 1]. Indeed, one observes in Fig. 12.4 (red lines) that ψ(t) is,
up to estimation errors, resembling the dynamics of ϕ(t). However, we want to stress
here that determination of the protophase-to-phase transformation is based on a statistical evaluation of the probability density of the protophase. Hence, in order to
achieve a proper reconstructions with small distortions in the protophase-to-phase
mapping, one needs long time series.
We can check for the similarity of θ n (t) or ψ n (t) to the true phase ϕ(t) by calculating a phase and a frequency error as the standard deviations
STD
q
n =
1
ˆ
N 1
t max
t min
[q n (τ ) − ϕ(τ )] 2 dτ
STD
˙
q
n =
1
ˆ
N 2
t max
t min
[ ˙
q n (τ ) − ˙
ϕ(τ )] 2 dτ
ˆ
N 1 =
t max
t min
(ϕ(τ ) − ˜
ωτ )
2 dτ
ˆ
N 2 =
t max
t min
[ ˙
ϕ(τ ) − ˜
ω]
2 dτ .
(12.17)