

166
A. Ben-Tal
dv
dt
= f 1
v, n, h p
(10.5)
dn
dt
= f 2 (v, n)
(10.6)
dh p
dt
= f 3
v, h p
(10.7)
where v is the neuron membrane potential, n is the gating of potassium, h p is the
gating of persistent sodium and f 1 , f 2 , f 3 are specific functions (see [4, 7] for more
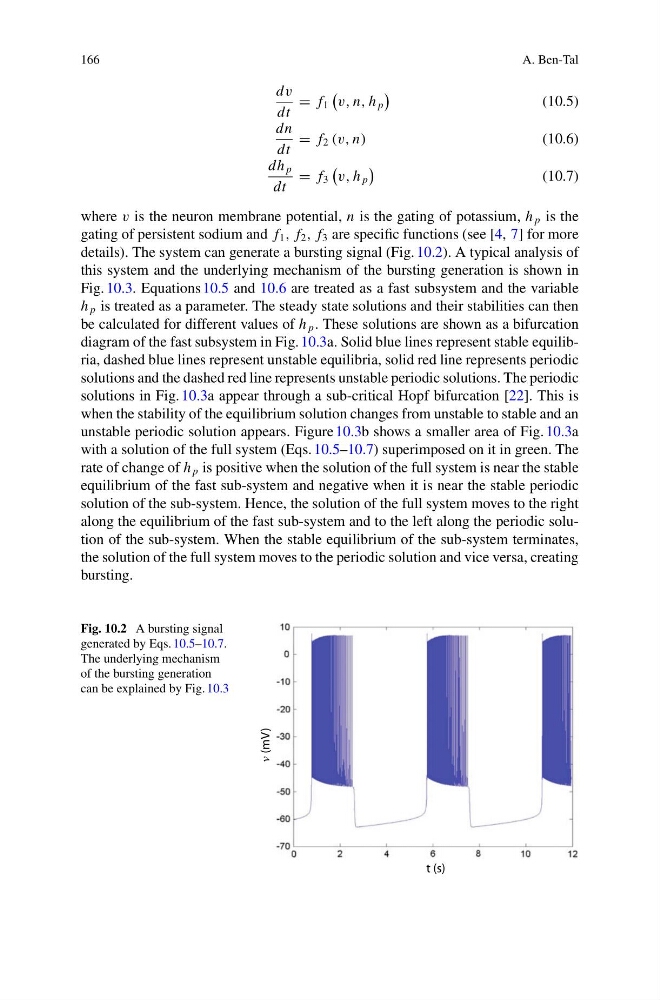
details). The system can generate a bursting signal (Fig. 10.2). A typical analysis of
this system and the underlying mechanism of the bursting generation is shown in
Fig. 10.3. Equations 10.5 and 10.6 are treated as a fast subsystem and the variable
h p is treated as a parameter. The steady state solutions and their stabilities can then
be calculated for different values of h p . These solutions are shown as a bifurcation
diagram of the fast subsystem in Fig. 10.3a. Solid blue lines represent stable equilibria, dashed blue lines represent unstable equilibria, solid red line represents periodic
solutions and the dashed red line represents unstable periodic solutions. The periodic
solutions in Fig. 10.3a appear through a sub-critical Hopf bifurcation [22]. This is
when the stability of the equilibrium solution changes from unstable to stable and an
unstable periodic solution appears. Figure 10.3b shows a smaller area of Fig. 10.3a
with a solution of the full system (Eqs. 10.5–10.7) superimposed on it in green. The
rate of change of h p is positive when the solution of the full system is near the stable
equilibrium of the fast sub-system and negative when it is near the stable periodic
solution of the sub-system. Hence, the solution of the full system moves to the right
along the equilibrium of the fast sub-system and to the left along the periodic solution of the sub-system. When the stable equilibrium of the sub-system terminates,
the solution of the full system moves to the periodic solution and vice versa, creating
bursting.
Fig. 10.2 A bursting signal
generated by Eqs. 10.5–10.7.
The underlying mechanism
of the bursting generation
can be explained by Fig. 10.3
t (s)
v
(mV)
A. Ben-Tal
dv
dt
= f 1
v, n, h p
(10.5)
dn
dt
= f 2 (v, n)
(10.6)
dh p
dt
= f 3
v, h p
(10.7)
where v is the neuron membrane potential, n is the gating of potassium, h p is the
gating of persistent sodium and f 1 , f 2 , f 3 are specific functions (see [4, 7] for more
details). The system can generate a bursting signal (Fig. 10.2). A typical analysis of
this system and the underlying mechanism of the bursting generation is shown in
Fig. 10.3. Equations 10.5 and 10.6 are treated as a fast subsystem and the variable
h p is treated as a parameter. The steady state solutions and their stabilities can then
be calculated for different values of h p . These solutions are shown as a bifurcation
diagram of the fast subsystem in Fig. 10.3a. Solid blue lines represent stable equilibria, dashed blue lines represent unstable equilibria, solid red line represents periodic
solutions and the dashed red line represents unstable periodic solutions. The periodic
solutions in Fig. 10.3a appear through a sub-critical Hopf bifurcation [22]. This is
when the stability of the equilibrium solution changes from unstable to stable and an
unstable periodic solution appears. Figure 10.3b shows a smaller area of Fig. 10.3a
with a solution of the full system (Eqs. 10.5–10.7) superimposed on it in green. The
rate of change of h p is positive when the solution of the full system is near the stable
equilibrium of the fast sub-system and negative when it is near the stable periodic
solution of the sub-system. Hence, the solution of the full system moves to the right
along the equilibrium of the fast sub-system and to the left along the periodic solution of the sub-system. When the stable equilibrium of the sub-system terminates,
the solution of the full system moves to the periodic solution and vice versa, creating
bursting.
Fig. 10.2 A bursting signal
generated by Eqs. 10.5–10.7.
The underlying mechanism
of the bursting generation
can be explained by Fig. 10.3
t (s)
v
(mV)