

16.9.2 Climate Change
Rising temperatures and growing aridity become evident in the palaeolimnological
indicators of the lakes of the Sierra Nevada (Anderson et al. 2011; Jiménez-Moreno
and Anderson 2012). In addition, an increase in the chlorophyll-a content of these
lakes over the last 120 years correlates well with temperature data for the corresponding period (Pérez-Martínez 2016). Overall, there has been progressive aridification over the last 7,000 years, with signs of a gradual increase in human activity
for the last 3,000 years (Jiménez-Moreno 2016).
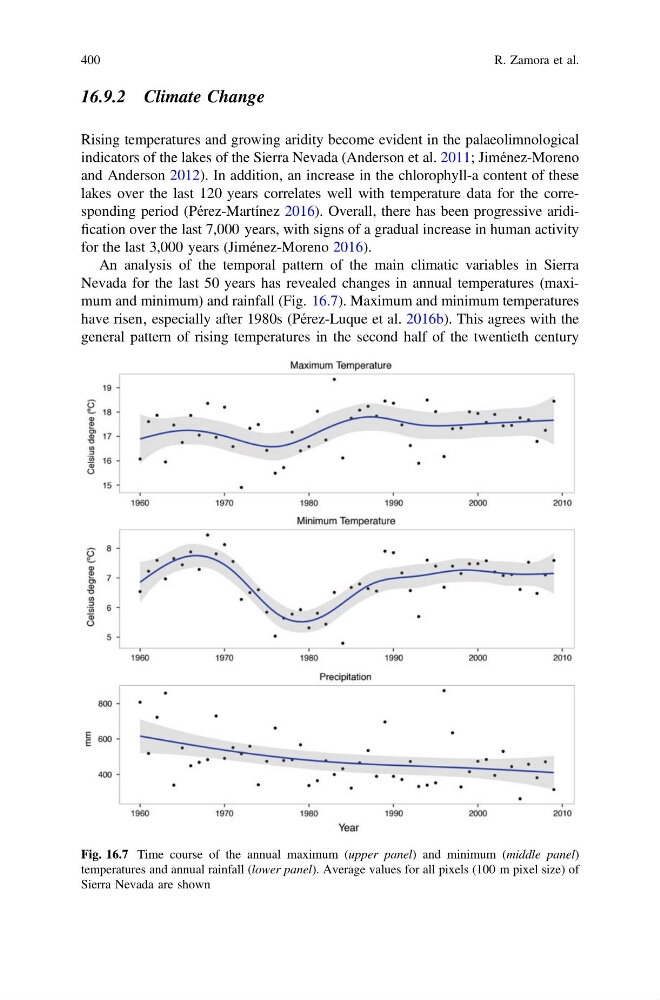
An analysis of the temporal pattern of the main climatic variables in Sierra
Nevada for the last 50 years has revealed changes in annual temperatures (maximum and minimum) and rainfall (Fig. 16.7). Maximum and minimum temperatures
have risen‚ especially after 1980s (Pérez-Luque et al. 2016b). This agrees with the
general pattern of rising temperatures in the second half of the twentieth century
Fig. 16.7 Time course of the annual maximum (upper panel) and minimum (middle panel)
temperatures and annual rainfall (lower panel). Average values for all pixels (100 m pixel size) of
Sierra Nevada are shown
400
R. Zamora et al.
Rising temperatures and growing aridity become evident in the palaeolimnological
indicators of the lakes of the Sierra Nevada (Anderson et al. 2011; Jiménez-Moreno
and Anderson 2012). In addition, an increase in the chlorophyll-a content of these
lakes over the last 120 years correlates well with temperature data for the corresponding period (Pérez-Martínez 2016). Overall, there has been progressive aridification over the last 7,000 years, with signs of a gradual increase in human activity
for the last 3,000 years (Jiménez-Moreno 2016).
An analysis of the temporal pattern of the main climatic variables in Sierra
Nevada for the last 50 years has revealed changes in annual temperatures (maximum and minimum) and rainfall (Fig. 16.7). Maximum and minimum temperatures
have risen‚ especially after 1980s (Pérez-Luque et al. 2016b). This agrees with the
general pattern of rising temperatures in the second half of the twentieth century
Fig. 16.7 Time course of the annual maximum (upper panel) and minimum (middle panel)
temperatures and annual rainfall (lower panel). Average values for all pixels (100 m pixel size) of
Sierra Nevada are shown
400
R. Zamora et al.