

Practical examples of use for this concentration of layers of ecological information taken at the same site and time are the following cases:
1. To establish robust spatiotemporal associations between variables that are closely related and that may depend each other‚ for example: (i) consumer/resource
relations, such as fleshy fruit abundance and the corresponding abundance of
frugivorous birds in the same plot, or flower and pollinator abundance;
(ii) measurements of temperature and phenological responses of plants and
animals associated on a per-plot basis; (iii) the relation between availability (dry
and wet deposition) of aerosols collected by the sensors of the multiparametric
tower and the in situ evaluation of processes of eutrophication in nearby aquatic
and terrestrial systems; (iv) ground-based collection of photographs acquired
from the same fixed location with phenocams for monitor phenological changes
in vegetation status and environmental changes over long periods at the same
site (Brown et al. 2016).
2. Comparison of data from sensors of a meteo-station with sensors placed in different microhabitats: on steep mountains slopes, the interplay between exposure
and vegetation is leading to mosaics of life conditions. For example, the temperature experienced by an organism in a particular microhabitat can be totally
different from the conditions measured by the nearest conventional meteo-station,
depending on their aerodynamic coupling to the atmosphere. The more strongly
an ecosystem is decoupled from atmospheric conditions by topography and
vegetation structure, the more thermal microhabitat variation is observed
(Scherrer and Körner 2010). Our Intensive Monitoring Station allows to analyse
in real time the average atmospheric meteo-value (low spatial resolution), and the
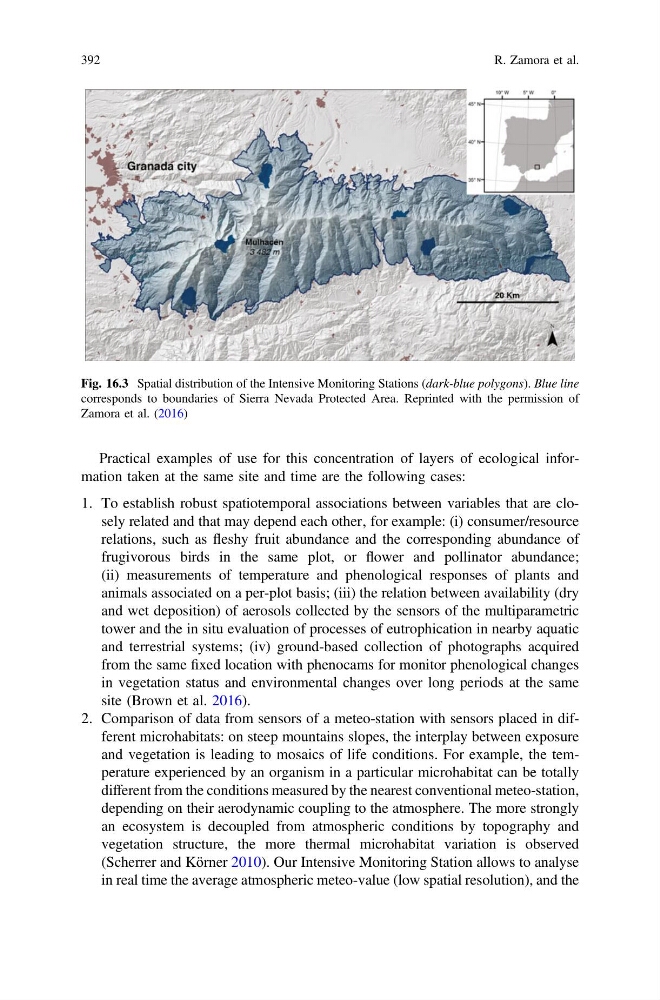
Fig. 16.3 Spatial distribution of the Intensive Monitoring Stations (dark-blue polygons). Blue line
corresponds to boundaries of Sierra Nevada Protected Area. Reprinted with the permission of
Zamora et al. (2016)
392
R. Zamora et al.
1. To establish robust spatiotemporal associations between variables that are closely related and that may depend each other‚ for example: (i) consumer/resource
relations, such as fleshy fruit abundance and the corresponding abundance of
frugivorous birds in the same plot, or flower and pollinator abundance;
(ii) measurements of temperature and phenological responses of plants and
animals associated on a per-plot basis; (iii) the relation between availability (dry
and wet deposition) of aerosols collected by the sensors of the multiparametric
tower and the in situ evaluation of processes of eutrophication in nearby aquatic
and terrestrial systems; (iv) ground-based collection of photographs acquired
from the same fixed location with phenocams for monitor phenological changes
in vegetation status and environmental changes over long periods at the same
site (Brown et al. 2016).
2. Comparison of data from sensors of a meteo-station with sensors placed in different microhabitats: on steep mountains slopes, the interplay between exposure
and vegetation is leading to mosaics of life conditions. For example, the temperature experienced by an organism in a particular microhabitat can be totally
different from the conditions measured by the nearest conventional meteo-station,
depending on their aerodynamic coupling to the atmosphere. The more strongly
an ecosystem is decoupled from atmospheric conditions by topography and
vegetation structure, the more thermal microhabitat variation is observed
(Scherrer and Körner 2010). Our Intensive Monitoring Station allows to analyse
in real time the average atmospheric meteo-value (low spatial resolution), and the
Fig. 16.3 Spatial distribution of the Intensive Monitoring Stations (dark-blue polygons). Blue line
corresponds to boundaries of Sierra Nevada Protected Area. Reprinted with the permission of
Zamora et al. (2016)
392
R. Zamora et al.