

15.6.2 Population Trajectories Under Different
Management Scenarios: Which Are
the Demographic Effects of SFS?
We built a prospective stochastic age-structured population model (only for
females) to explore the functional dependence of k (the population growth rate) on
the demographic rates of the study population. This kind of perturbation analysis
allows us to identify potential management targets because variations in demographic parameters with high sensitivity (or elasticity) produce large changes in k.
We also built a retrospective stochastic population model to detect whether
parameters used in the prospective model were reliable and described with certainty
the behaviour of the population. Here, we used the same structure and number of
replications as that of the prospective model but run over the period for which data
were collected (20 years), setting the initial population size to that estimated in
1985 (i.e. 37 breeding females).
The current combination of demographic parameters of the Spanish bearded
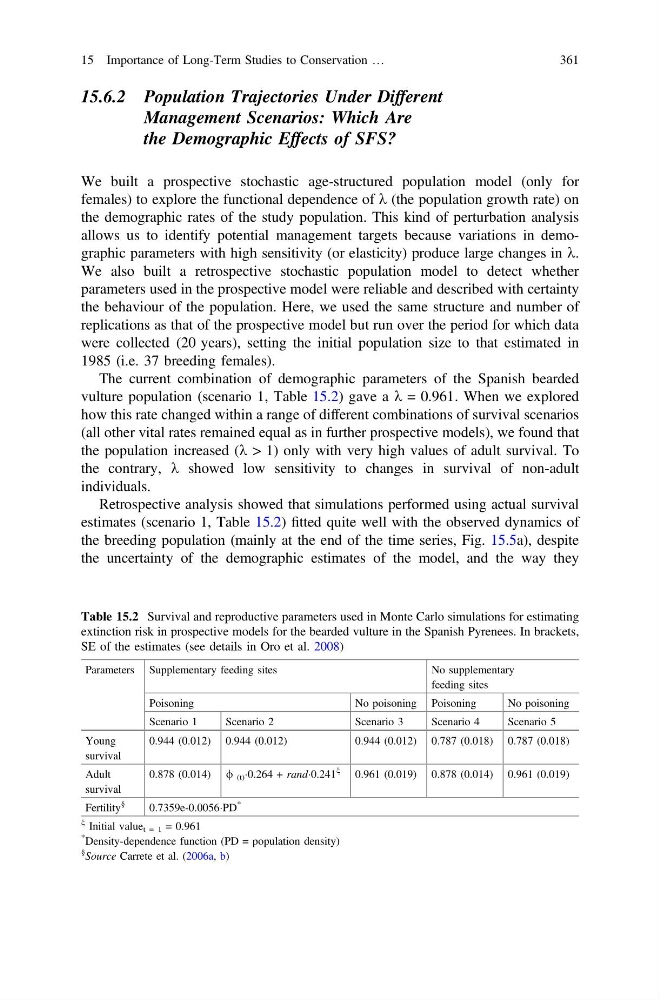
vulture population (scenario 1, Table 15.2) gave a k = 0.961. When we explored
how this rate changed within a range of different combinations of survival scenarios
(all other vital rates remained equal as in further prospective models), we found that
the population increased (k > 1) only with very high values of adult survival. To
the contrary, k showed low sensitivity to changes in survival of non-adult
individuals.
Retrospective analysis showed that simulations performed using actual survival
estimates (scenario 1, Table 15.2) fitted quite well with the observed dynamics of
the breeding population (mainly at the end of the time series, Fig. 15.5a), despite
the uncertainty of the demographic estimates of the model, and the way they
Table 15.2 Survival and reproductive parameters used in Monte Carlo simulations for estimating
extinction risk in prospective models for the bearded vulture in the Spanish Pyrenees. In brackets,
SE of the estimates (see details in Oro et al. 2008)
Parameters Supplementary feeding sites
No supplementary
feeding sites
Poisoning
No poisoning Poisoning
No poisoning
Scenario 1
Scenario 2
Scenario 3
Scenario 4
Scenario 5
Young
survival
0.944 (0.012) 0.944 (0.012)
0.944 (0.012) 0.787 (0.018) 0.787 (0.018)
Adult
survival
0.878 (0.014) / (t) Á0.264 + randÁ0.241
n
0.961 (0.019) 0.878 (0.014) 0.961 (0.019)
Fertility
§
0.7359e-0.0056ÁPD
*
n Initial value t = 1 = 0.961
*
Density-dependence function (PD = population density)
§
Source Carrete et al. (2006a, b)
15 Importance of Long-Term Studies to Conservation …
361
Management Scenarios: Which Are
the Demographic Effects of SFS?
We built a prospective stochastic age-structured population model (only for
females) to explore the functional dependence of k (the population growth rate) on
the demographic rates of the study population. This kind of perturbation analysis
allows us to identify potential management targets because variations in demographic parameters with high sensitivity (or elasticity) produce large changes in k.
We also built a retrospective stochastic population model to detect whether
parameters used in the prospective model were reliable and described with certainty
the behaviour of the population. Here, we used the same structure and number of
replications as that of the prospective model but run over the period for which data
were collected (20 years), setting the initial population size to that estimated in
1985 (i.e. 37 breeding females).
The current combination of demographic parameters of the Spanish bearded
vulture population (scenario 1, Table 15.2) gave a k = 0.961. When we explored
how this rate changed within a range of different combinations of survival scenarios
(all other vital rates remained equal as in further prospective models), we found that
the population increased (k > 1) only with very high values of adult survival. To
the contrary, k showed low sensitivity to changes in survival of non-adult
individuals.
Retrospective analysis showed that simulations performed using actual survival
estimates (scenario 1, Table 15.2) fitted quite well with the observed dynamics of
the breeding population (mainly at the end of the time series, Fig. 15.5a), despite
the uncertainty of the demographic estimates of the model, and the way they
Table 15.2 Survival and reproductive parameters used in Monte Carlo simulations for estimating
extinction risk in prospective models for the bearded vulture in the Spanish Pyrenees. In brackets,
SE of the estimates (see details in Oro et al. 2008)
Parameters Supplementary feeding sites
No supplementary
feeding sites
Poisoning
No poisoning Poisoning
No poisoning
Scenario 1
Scenario 2
Scenario 3
Scenario 4
Scenario 5
Young
survival
0.944 (0.012) 0.944 (0.012)
0.944 (0.012) 0.787 (0.018) 0.787 (0.018)
Adult
survival
0.878 (0.014) / (t) Á0.264 + randÁ0.241
n
0.961 (0.019) 0.878 (0.014) 0.961 (0.019)
Fertility
§
0.7359e-0.0056ÁPD
*
n Initial value t = 1 = 0.961
*
Density-dependence function (PD = population density)
§
Source Carrete et al. (2006a, b)
15 Importance of Long-Term Studies to Conservation …
361