

year
−1 , matching the global average. This deposition rate has been increasing during
the precedent decade, in good agreement with the Spanish inventory of nitrogen
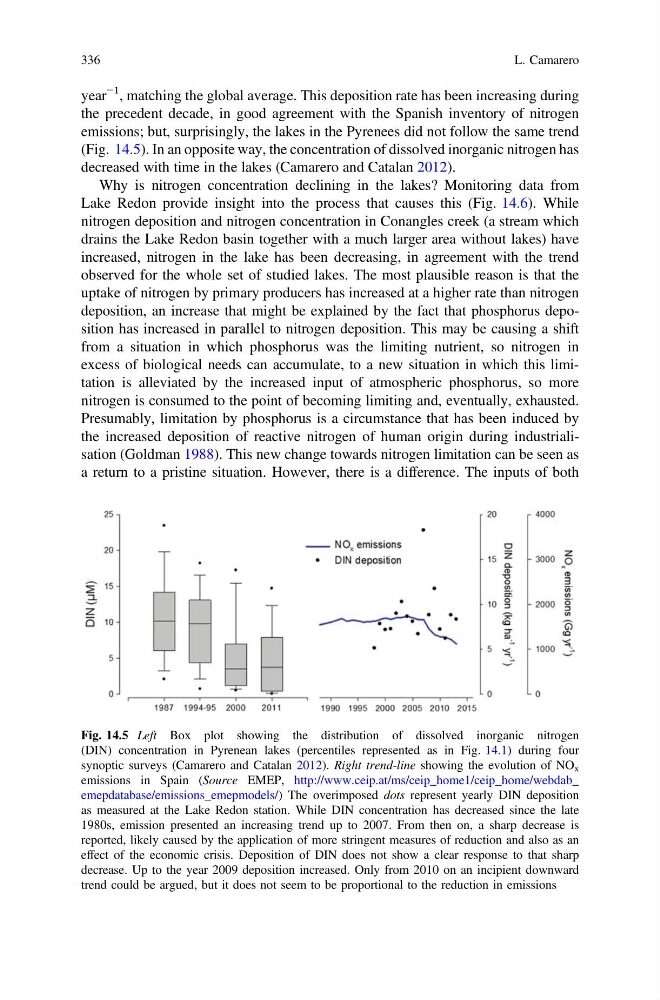
emissions; but, surprisingly, the lakes in the Pyrenees did not follow the same trend
(Fig. 14.5). In an opposite way, the concentration of dissolved inorganic nitrogen has
decreased with time in the lakes (Camarero and Catalan 2012).
Why is nitrogen concentration declining in the lakes? Monitoring data from
Lake Redon provide insight into the process that causes this (Fig. 14.6). While
nitrogen deposition and nitrogen concentration in Conangles creek (a stream which
drains the Lake Redon basin together with a much larger area without lakes) have
increased, nitrogen in the lake has been decreasing, in agreement with the trend
observed for the whole set of studied lakes. The most plausible reason is that the
uptake of nitrogen by primary producers has increased at a higher rate than nitrogen
deposition, an increase that might be explained by the fact that phosphorus deposition has increased in parallel to nitrogen deposition. This may be causing a shift
from a situation in which phosphorus was the limiting nutrient, so nitrogen in
excess of biological needs can accumulate, to a new situation in which this limitation is alleviated by the increased input of atmospheric phosphorus, so more
nitrogen is consumed to the point of becoming limiting and, eventually, exhausted.
Presumably, limitation by phosphorus is a circumstance that has been induced by
the increased deposition of reactive nitrogen of human origin during industrialisation (Goldman 1988). This new change towards nitrogen limitation can be seen as
a return to a pristine situation. However, there is a difference. The inputs of both
Fig. 14.5 Left Box plot showing the distribution of dissolved inorganic nitrogen
(DIN) concentration in Pyrenean lakes (percentiles represented as in Fig. 14.1) during four
synoptic surveys (Camarero and Catalan 2012). Right trend-line showing the evolution of NO x
emissions in Spain (Source EMEP, http://www.ceip.at/ms/ceip_home1/ceip_home/webdab_
emepdatabase/emissions_emepmodels/) The overimposed dots represent yearly DIN deposition
as measured at the Lake Redon station. While DIN concentration has decreased since the late
1980s, emission presented an increasing trend up to 2007. From then on, a sharp decrease is
reported, likely caused by the application of more stringent measures of reduction and also as an
effect of the economic crisis. Deposition of DIN does not show a clear response to that sharp
decrease. Up to the year 2009 deposition increased. Only from 2010 on an incipient downward
trend could be argued, but it does not seem to be proportional to the reduction in emissions
336
L. Camarero
−1 , matching the global average. This deposition rate has been increasing during
the precedent decade, in good agreement with the Spanish inventory of nitrogen
emissions; but, surprisingly, the lakes in the Pyrenees did not follow the same trend
(Fig. 14.5). In an opposite way, the concentration of dissolved inorganic nitrogen has
decreased with time in the lakes (Camarero and Catalan 2012).
Why is nitrogen concentration declining in the lakes? Monitoring data from
Lake Redon provide insight into the process that causes this (Fig. 14.6). While
nitrogen deposition and nitrogen concentration in Conangles creek (a stream which
drains the Lake Redon basin together with a much larger area without lakes) have
increased, nitrogen in the lake has been decreasing, in agreement with the trend
observed for the whole set of studied lakes. The most plausible reason is that the
uptake of nitrogen by primary producers has increased at a higher rate than nitrogen
deposition, an increase that might be explained by the fact that phosphorus deposition has increased in parallel to nitrogen deposition. This may be causing a shift
from a situation in which phosphorus was the limiting nutrient, so nitrogen in
excess of biological needs can accumulate, to a new situation in which this limitation is alleviated by the increased input of atmospheric phosphorus, so more
nitrogen is consumed to the point of becoming limiting and, eventually, exhausted.
Presumably, limitation by phosphorus is a circumstance that has been induced by
the increased deposition of reactive nitrogen of human origin during industrialisation (Goldman 1988). This new change towards nitrogen limitation can be seen as
a return to a pristine situation. However, there is a difference. The inputs of both
Fig. 14.5 Left Box plot showing the distribution of dissolved inorganic nitrogen
(DIN) concentration in Pyrenean lakes (percentiles represented as in Fig. 14.1) during four
synoptic surveys (Camarero and Catalan 2012). Right trend-line showing the evolution of NO x
emissions in Spain (Source EMEP, http://www.ceip.at/ms/ceip_home1/ceip_home/webdab_
emepdatabase/emissions_emepmodels/) The overimposed dots represent yearly DIN deposition
as measured at the Lake Redon station. While DIN concentration has decreased since the late
1980s, emission presented an increasing trend up to 2007. From then on, a sharp decrease is
reported, likely caused by the application of more stringent measures of reduction and also as an
effect of the economic crisis. Deposition of DIN does not show a clear response to that sharp
decrease. Up to the year 2009 deposition increased. Only from 2010 on an incipient downward
trend could be argued, but it does not seem to be proportional to the reduction in emissions
336
L. Camarero