

precipitation (skewed) and temperature (normal), we selected the 25th and 75th
percentiles, and through their combination we obtained four types of days:
wet-cold, wet-warm, dry-cold and dry-warm days (Beniston and Goyette 2007).
The yearly exceedance series of these joint thresholds were then calculated for
winter and spring, and their trends over time were estimated.
• In order to explore changes in the timing of mountain flows, we calculated
several indices related to the time of the year when the spring pulse from melting
waters is recorded: the day of the maximum spring flows, the day when the 75th
percentile of yearly (considering the water year with a start in October 1st) flows
is reached, and the day when spring pulse begins (Cayan et al. 2001). By
looking at temporal trends in the values of these indices, we can observe if the
nival signal of Pyrenean Rivers tended to diminish or augment.
Further, statistical analysis included the computation of correlations using the
Pearson’s correlation test, the estimation of temporal trends using Mann–Kendall’s
test and the estimation of patterns in the evolution of hydro-climatic variables using
Principal Component Analysis in S mode.
13.4 Climate Evolution
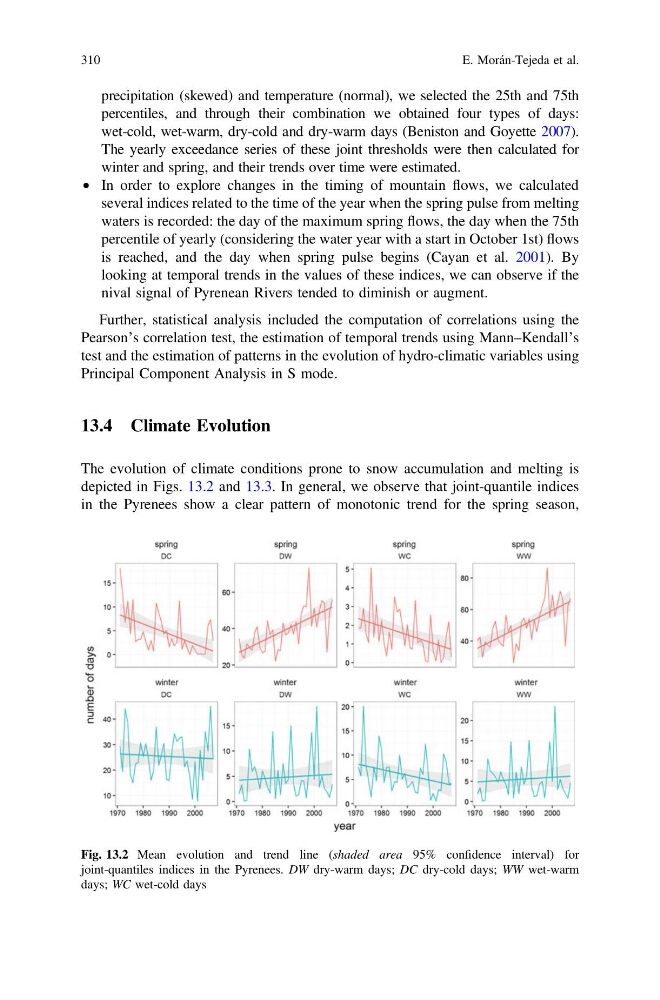
The evolution of climate conditions prone to snow accumulation and melting is
depicted in Figs. 13.2 and 13.3. In general, we observe that joint-quantile indices
in the Pyrenees show a clear pattern of monotonic trend for the spring season,
Fig. 13.2 Mean evolution and trend line (shaded area 95% confidence interval) for
joint-quantiles indices in the Pyrenees. DW dry-warm days; DC dry-cold days; WW wet-warm
days; WC wet-cold days
310
E. Morán-Tejeda et al.
percentiles, and through their combination we obtained four types of days:
wet-cold, wet-warm, dry-cold and dry-warm days (Beniston and Goyette 2007).
The yearly exceedance series of these joint thresholds were then calculated for
winter and spring, and their trends over time were estimated.
• In order to explore changes in the timing of mountain flows, we calculated
several indices related to the time of the year when the spring pulse from melting
waters is recorded: the day of the maximum spring flows, the day when the 75th
percentile of yearly (considering the water year with a start in October 1st) flows
is reached, and the day when spring pulse begins (Cayan et al. 2001). By
looking at temporal trends in the values of these indices, we can observe if the
nival signal of Pyrenean Rivers tended to diminish or augment.
Further, statistical analysis included the computation of correlations using the
Pearson’s correlation test, the estimation of temporal trends using Mann–Kendall’s
test and the estimation of patterns in the evolution of hydro-climatic variables using
Principal Component Analysis in S mode.
13.4 Climate Evolution
The evolution of climate conditions prone to snow accumulation and melting is
depicted in Figs. 13.2 and 13.3. In general, we observe that joint-quantile indices
in the Pyrenees show a clear pattern of monotonic trend for the spring season,
Fig. 13.2 Mean evolution and trend line (shaded area 95% confidence interval) for
joint-quantiles indices in the Pyrenees. DW dry-warm days; DC dry-cold days; WW wet-warm
days; WC wet-cold days
310
E. Morán-Tejeda et al.