

192
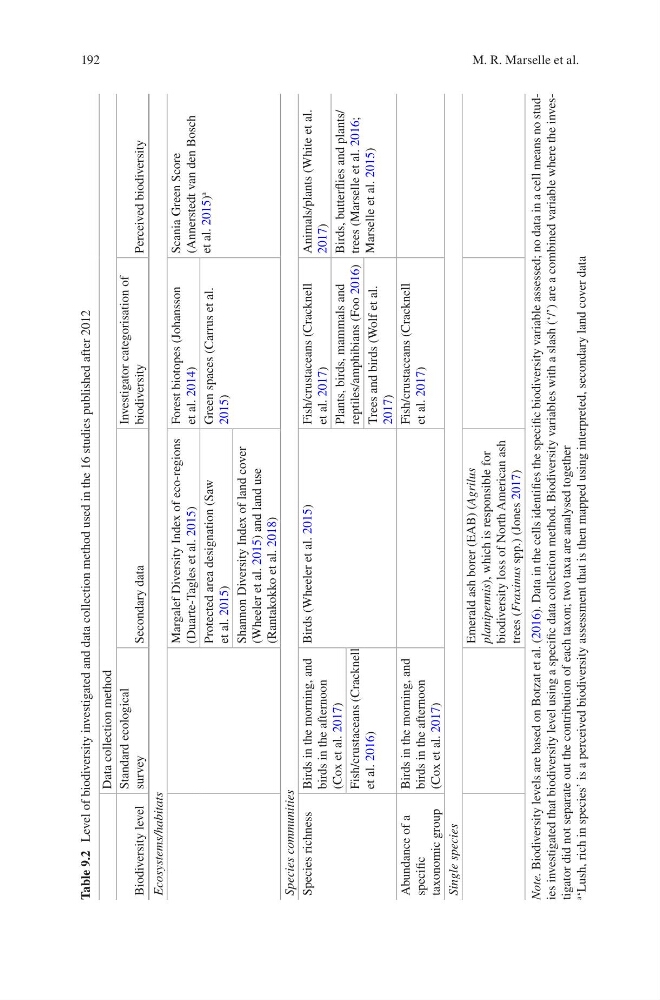
Table 9.2 Level of biodiversity investigated and data collection method used in the 16 studies published after 2012
Data collection method
Biodiversity level
Standard ecological
survey
Secondary data
Investigator categorisation of
biodiversity
Perceived biodiversity
Ecosystems/habitats
Margalef Diversity Index of eco-regions
(Duarte-Tagles et al. 2015)
Forest biotopes (Johansson
et al. 2014)
Scania Green Score
(Annerstedt van den Bosch
et al. 2015)
a
Protected area designation (Saw
et al. 2015)
Green spaces (Carrus et al.
2015)
Shannon Diversity Index of land cover
(Wheeler et al. 2015) and land use
(Rantakokko et al. 2018)
Species communities
Species richness
Birds in the morning, and
birds in the afternoon
(Cox et al. 2017)
Birds (Wheeler et al. 2015)
Fish/crustaceans (Cracknell
et al. 2017)
Animals/plants (White et al.
2017)
Plants, birds, mammals and
reptiles/amphibians (Foo 2016)
Birds, butterflies and plants/
trees (Marselle et al. 2016;
Marselle et al. 2015)
Fish/crustaceans (Cracknell
et al. 2016)
Trees and birds (Wolf et al.
2017)
Abundance of a
specific
taxonomic group
Birds in the morning, and
birds in the afternoon
(Cox et al. 2017)
Fish/crustaceans (Cracknell
et al. 2017)
Single species
Emerald ash borer (EAB) (Agrilus
planipennis),
which is responsible for
biodiversity loss of North American ash
trees (Fraxinus spp.) (Jones 2017)
Note.
Biodiversity levels are based on Botzat et al. (2016). Data in the cells identifies the specific biodiversity variable assessed; no data in a cell means no studies investigated that biodiversity level using a specific data collection method. Biodiversity variables with a slash (‘/’) are a combined variable where the investigator did not separate out the contribution of each taxon; two taxa are analysed together
a
‘Lush, rich in species’ is a perceived biodiversity assessment that is then mapped using interpreted, secondary land cover data
M. R. Marselle et al.
Table 9.2 Level of biodiversity investigated and data collection method used in the 16 studies published after 2012
Data collection method
Biodiversity level
Standard ecological
survey
Secondary data
Investigator categorisation of
biodiversity
Perceived biodiversity
Ecosystems/habitats
Margalef Diversity Index of eco-regions
(Duarte-Tagles et al. 2015)
Forest biotopes (Johansson
et al. 2014)
Scania Green Score
(Annerstedt van den Bosch
et al. 2015)
a
Protected area designation (Saw
et al. 2015)
Green spaces (Carrus et al.
2015)
Shannon Diversity Index of land cover
(Wheeler et al. 2015) and land use
(Rantakokko et al. 2018)
Species communities
Species richness
Birds in the morning, and
birds in the afternoon
(Cox et al. 2017)
Birds (Wheeler et al. 2015)
Fish/crustaceans (Cracknell
et al. 2017)
Animals/plants (White et al.
2017)
Plants, birds, mammals and
reptiles/amphibians (Foo 2016)
Birds, butterflies and plants/
trees (Marselle et al. 2016;
Marselle et al. 2015)
Fish/crustaceans (Cracknell
et al. 2016)
Trees and birds (Wolf et al.
2017)
Abundance of a
specific
taxonomic group
Birds in the morning, and
birds in the afternoon
(Cox et al. 2017)
Fish/crustaceans (Cracknell
et al. 2017)
Single species
Emerald ash borer (EAB) (Agrilus
planipennis),
which is responsible for
biodiversity loss of North American ash
trees (Fraxinus spp.) (Jones 2017)
Note.
Biodiversity levels are based on Botzat et al. (2016). Data in the cells identifies the specific biodiversity variable assessed; no data in a cell means no studies investigated that biodiversity level using a specific data collection method. Biodiversity variables with a slash (‘/’) are a combined variable where the investigator did not separate out the contribution of each taxon; two taxa are analysed together
a
‘Lush, rich in species’ is a perceived biodiversity assessment that is then mapped using interpreted, secondary land cover data
M. R. Marselle et al.