

50 Acoustic Emissions of Cathode Carbon Block …
563
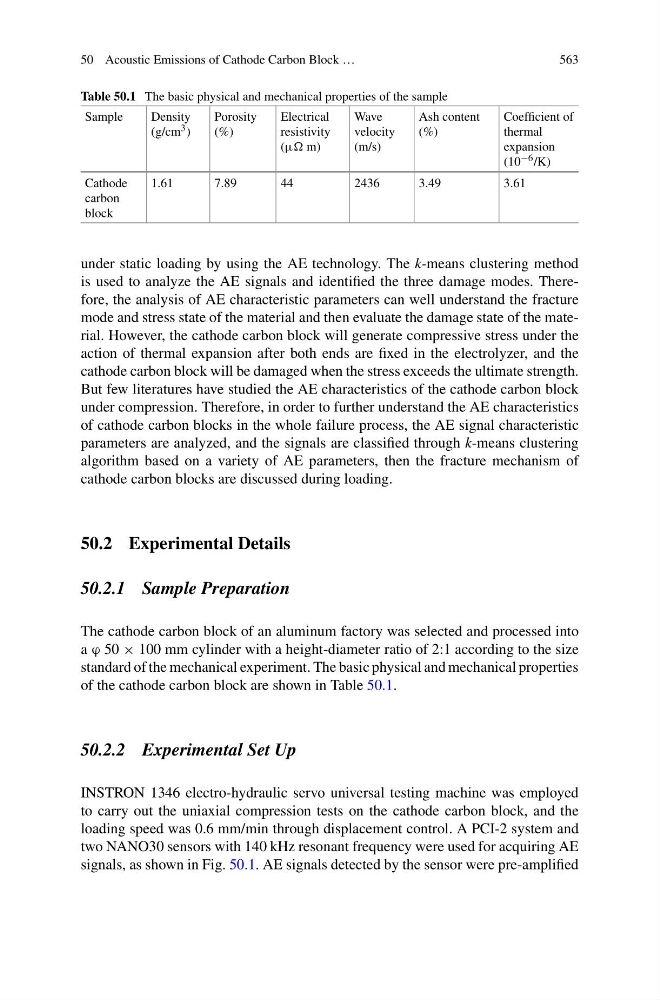
Table 50.1 The basic physical and mechanical properties of the sample
Sample
Density
(g/cm 3 )
Porosity
(%)
Electrical
resistivity
(μ m)
Wave
velocity
(m/s)
Ash content
(%)
Coefficient of
thermal
expansion
(10 −6 /K)
Cathode
carbon
block
1.61
7.89
44
2436
3.49
3.61
under static loading by using the AE technology. The k-means clustering method
is used to analyze the AE signals and identified the three damage modes. Therefore, the analysis of AE characteristic parameters can well understand the fracture
mode and stress state of the material and then evaluate the damage state of the material. However, the cathode carbon block will generate compressive stress under the
action of thermal expansion after both ends are fixed in the electrolyzer, and the
cathode carbon block will be damaged when the stress exceeds the ultimate strength.
But few literatures have studied the AE characteristics of the cathode carbon block
under compression. Therefore, in order to further understand the AE characteristics
of cathode carbon blocks in the whole failure process, the AE signal characteristic
parameters are analyzed, and the signals are classified through k-means clustering
algorithm based on a variety of AE parameters, then the fracture mechanism of
cathode carbon blocks are discussed during loading.
50.2 Experimental Details
50.2.1 Sample Preparation
The cathode carbon block of an aluminum factory was selected and processed into
a ϕ 50 × 100 mm cylinder with a height-diameter ratio of 2:1 according to the size
standard of the mechanical experiment. The basic physical and mechanical properties
of the cathode carbon block are shown in Table 50.1.
50.2.2 Experimental Set Up
INSTRON 1346 electro-hydraulic servo universal testing machine was employed
to carry out the uniaxial compression tests on the cathode carbon block, and the
loading speed was 0.6 mm/min through displacement control. A PCI-2 system and
two NANO30 sensors with 140 kHz resonant frequency were used for acquiring AE
signals, as shown in Fig. 50.1. AE signals detected by the sensor were pre-amplified
563
Table 50.1 The basic physical and mechanical properties of the sample
Sample
Density
(g/cm 3 )
Porosity
(%)
Electrical
resistivity
(μ m)
Wave
velocity
(m/s)
Ash content
(%)
Coefficient of
thermal
expansion
(10 −6 /K)
Cathode
carbon
block
1.61
7.89
44
2436
3.49
3.61
under static loading by using the AE technology. The k-means clustering method
is used to analyze the AE signals and identified the three damage modes. Therefore, the analysis of AE characteristic parameters can well understand the fracture
mode and stress state of the material and then evaluate the damage state of the material. However, the cathode carbon block will generate compressive stress under the
action of thermal expansion after both ends are fixed in the electrolyzer, and the
cathode carbon block will be damaged when the stress exceeds the ultimate strength.
But few literatures have studied the AE characteristics of the cathode carbon block
under compression. Therefore, in order to further understand the AE characteristics
of cathode carbon blocks in the whole failure process, the AE signal characteristic
parameters are analyzed, and the signals are classified through k-means clustering
algorithm based on a variety of AE parameters, then the fracture mechanism of
cathode carbon blocks are discussed during loading.
50.2 Experimental Details
50.2.1 Sample Preparation
The cathode carbon block of an aluminum factory was selected and processed into
a ϕ 50 × 100 mm cylinder with a height-diameter ratio of 2:1 according to the size
standard of the mechanical experiment. The basic physical and mechanical properties
of the cathode carbon block are shown in Table 50.1.
50.2.2 Experimental Set Up
INSTRON 1346 electro-hydraulic servo universal testing machine was employed
to carry out the uniaxial compression tests on the cathode carbon block, and the
loading speed was 0.6 mm/min through displacement control. A PCI-2 system and
two NANO30 sensors with 140 kHz resonant frequency were used for acquiring AE
signals, as shown in Fig. 50.1. AE signals detected by the sensor were pre-amplified