

48 The AE Monitoring in Load Testing in Helicopter …
545
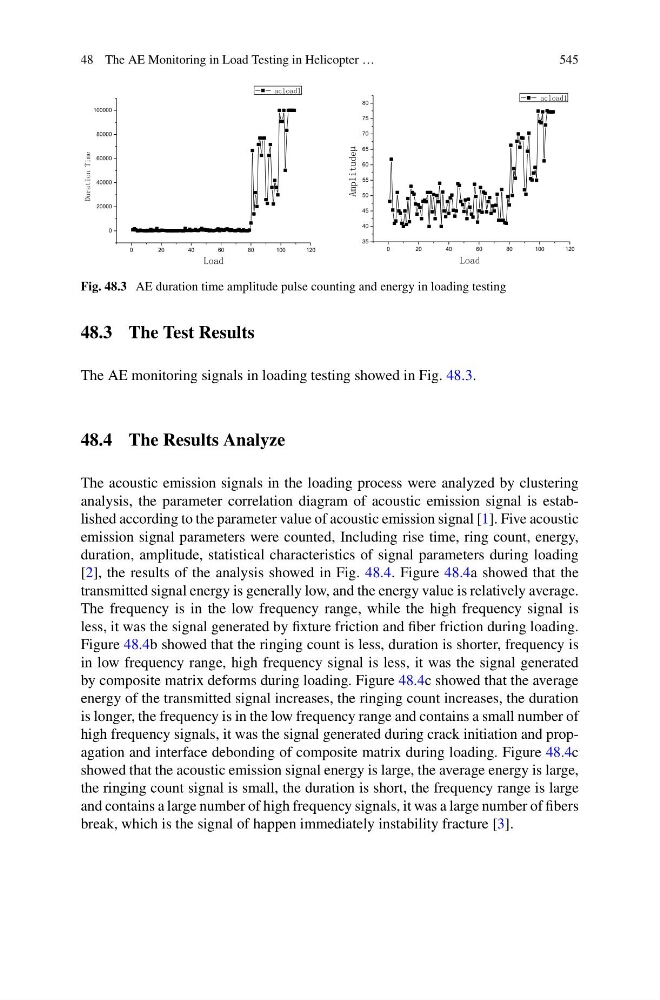
Fig. 48.3 AE duration time amplitude pulse counting and energy in loading testing
48.3 The Test Results
The AE monitoring signals in loading testing showed in Fig. 48.3.
48.4 The Results Analyze
The acoustic emission signals in the loading process were analyzed by clustering
analysis, the parameter correlation diagram of acoustic emission signal is established according to the parameter value of acoustic emission signal [1]. Five acoustic
emission signal parameters were counted, Including rise time, ring count, energy,
duration, amplitude, statistical characteristics of signal parameters during loading
[2], the results of the analysis showed in Fig. 48.4. Figure 48.4a showed that the
transmitted signal energy is generally low, and the energy value is relatively average.
The frequency is in the low frequency range, while the high frequency signal is
less, it was the signal generated by fixture friction and fiber friction during loading.
Figure 48.4b showed that the ringing count is less, duration is shorter, frequency is
in low frequency range, high frequency signal is less, it was the signal generated
by composite matrix deforms during loading. Figure 48.4c showed that the average
energy of the transmitted signal increases, the ringing count increases, the duration
is longer, the frequency is in the low frequency range and contains a small number of
high frequency signals, it was the signal generated during crack initiation and propagation and interface debonding of composite matrix during loading. Figure 48.4c
showed that the acoustic emission signal energy is large, the average energy is large,
the ringing count signal is small, the duration is short, the frequency range is large
and contains a large number of high frequency signals, it was a large number of fibers
break, which is the signal of happen immediately instability fracture [3].
545
Fig. 48.3 AE duration time amplitude pulse counting and energy in loading testing
48.3 The Test Results
The AE monitoring signals in loading testing showed in Fig. 48.3.
48.4 The Results Analyze
The acoustic emission signals in the loading process were analyzed by clustering
analysis, the parameter correlation diagram of acoustic emission signal is established according to the parameter value of acoustic emission signal [1]. Five acoustic
emission signal parameters were counted, Including rise time, ring count, energy,
duration, amplitude, statistical characteristics of signal parameters during loading
[2], the results of the analysis showed in Fig. 48.4. Figure 48.4a showed that the
transmitted signal energy is generally low, and the energy value is relatively average.
The frequency is in the low frequency range, while the high frequency signal is
less, it was the signal generated by fixture friction and fiber friction during loading.
Figure 48.4b showed that the ringing count is less, duration is shorter, frequency is
in low frequency range, high frequency signal is less, it was the signal generated
by composite matrix deforms during loading. Figure 48.4c showed that the average
energy of the transmitted signal increases, the ringing count increases, the duration
is longer, the frequency is in the low frequency range and contains a small number of
high frequency signals, it was the signal generated during crack initiation and propagation and interface debonding of composite matrix during loading. Figure 48.4c
showed that the acoustic emission signal energy is large, the average energy is large,
the ringing count signal is small, the duration is short, the frequency range is large
and contains a large number of high frequency signals, it was a large number of fibers
break, which is the signal of happen immediately instability fracture [3].