

512
Z. Wu et al.
is the weakest link of the whole truss beam. The strength margin of the main chord
is greater.
44.4.2 AE Parameters Characteristics of AE Location Events
During the Test
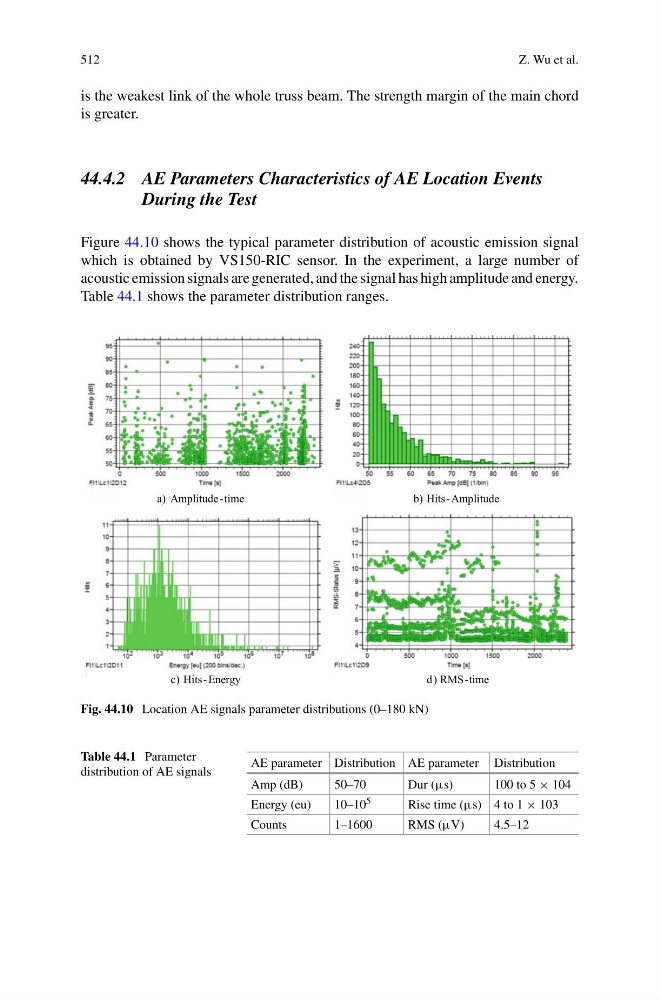
Figure 44.10 shows the typical parameter distribution of acoustic emission signal
which is obtained by VS150-RIC sensor. In the experiment, a large number of
acoustic emission signals are generated, and the signal has high amplitude and energy.
Table 44.1 shows the parameter distribution ranges.
a) Amplitude -time
b) Hits- Amplitude
c) Hits - Energy
d ) RMS-time
Fig. 44.10 Location AE signals parameter distributions (0–180 kN)
Table 44.1 Parameter
distribution of AE signals
AE parameter Distribution AE parameter Distribution
Amp (dB)
50–70
Dur (µs)
100 to 5 × 10⁴
Energy (eu)
10–10 5
Rise time (µs) 4 to 1 × 10³
Counts
1–1600
RMS (µV)
4.5–12
Z. Wu et al.
is the weakest link of the whole truss beam. The strength margin of the main chord
is greater.
44.4.2 AE Parameters Characteristics of AE Location Events
During the Test
Figure 44.10 shows the typical parameter distribution of acoustic emission signal
which is obtained by VS150-RIC sensor. In the experiment, a large number of
acoustic emission signals are generated, and the signal has high amplitude and energy.
Table 44.1 shows the parameter distribution ranges.
a) Amplitude -time
b) Hits- Amplitude
c) Hits - Energy
d ) RMS-time
Fig. 44.10 Location AE signals parameter distributions (0–180 kN)
Table 44.1 Parameter
distribution of AE signals
AE parameter Distribution AE parameter Distribution
Amp (dB)
50–70
Dur (µs)
100 to 5 × 10⁴
Energy (eu)
10–10 5
Rise time (µs) 4 to 1 × 10³
Counts
1–1600
RMS (µV)
4.5–12