

44 Acoustic Emission Characteristics of Defects …
505
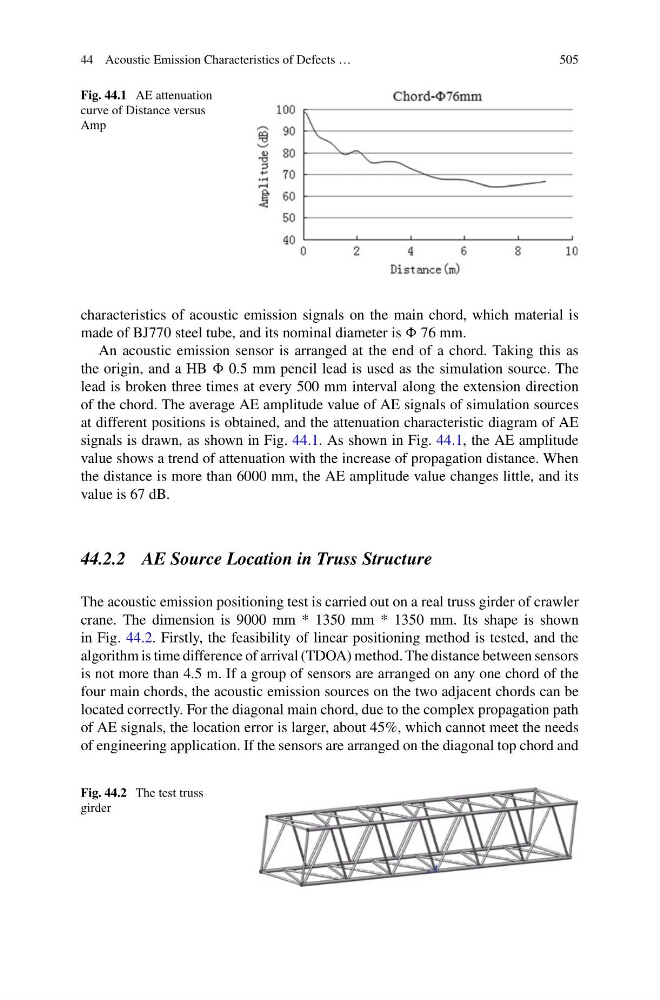
Fig. 44.1 AE attenuation
curve of Distance versus
Amp
characteristics of acoustic emission signals on the main chord, which material is
made of BJ770 steel tube, and its nominal diameter is 76 mm.
An acoustic emission sensor is arranged at the end of a chord. Taking this as
the origin, and a HB 0.5 mm pencil lead is used as the simulation source. The
lead is broken three times at every 500 mm interval along the extension direction
of the chord. The average AE amplitude value of AE signals of simulation sources
at different positions is obtained, and the attenuation characteristic diagram of AE
signals is drawn, as shown in Fig. 44.1. As shown in Fig. 44.1, the AE amplitude
value shows a trend of attenuation with the increase of propagation distance. When
the distance is more than 6000 mm, the AE amplitude value changes little, and its
value is 67 dB.
44.2.2 AE Source Location in Truss Structure
The acoustic emission positioning test is carried out on a real truss girder of crawler
crane. The dimension is 9000 mm * 1350 mm * 1350 mm. Its shape is shown
in Fig. 44.2. Firstly, the feasibility of linear positioning method is tested, and the
algorithm is time difference of arrival (TDOA) method. The distance between sensors
is not more than 4.5 m. If a group of sensors are arranged on any one chord of the
four main chords, the acoustic emission sources on the two adjacent chords can be
located correctly. For the diagonal main chord, due to the complex propagation path
of AE signals, the location error is larger, about 45%, which cannot meet the needs
of engineering application. If the sensors are arranged on the diagonal top chord and
Fig. 44.2 The test truss
girder
505
Fig. 44.1 AE attenuation
curve of Distance versus
Amp
characteristics of acoustic emission signals on the main chord, which material is
made of BJ770 steel tube, and its nominal diameter is 76 mm.
An acoustic emission sensor is arranged at the end of a chord. Taking this as
the origin, and a HB 0.5 mm pencil lead is used as the simulation source. The
lead is broken three times at every 500 mm interval along the extension direction
of the chord. The average AE amplitude value of AE signals of simulation sources
at different positions is obtained, and the attenuation characteristic diagram of AE
signals is drawn, as shown in Fig. 44.1. As shown in Fig. 44.1, the AE amplitude
value shows a trend of attenuation with the increase of propagation distance. When
the distance is more than 6000 mm, the AE amplitude value changes little, and its
value is 67 dB.
44.2.2 AE Source Location in Truss Structure
The acoustic emission positioning test is carried out on a real truss girder of crawler
crane. The dimension is 9000 mm * 1350 mm * 1350 mm. Its shape is shown
in Fig. 44.2. Firstly, the feasibility of linear positioning method is tested, and the
algorithm is time difference of arrival (TDOA) method. The distance between sensors
is not more than 4.5 m. If a group of sensors are arranged on any one chord of the
four main chords, the acoustic emission sources on the two adjacent chords can be
located correctly. For the diagonal main chord, due to the complex propagation path
of AE signals, the location error is larger, about 45%, which cannot meet the needs
of engineering application. If the sensors are arranged on the diagonal top chord and
Fig. 44.2 The test truss
girder