

494
X. Zeng et al.
theory of wavelet analysis, modern spectral analysis and neural network analysis
have also been applied. In this study, the analyses of AE characteristic parameters
and waveform were carried out.
43.3.2 The Analysis of AE Characteristic Parameters
In traditional AE processing, various AE parameters are used for describing AE
signals. AE energy is calculated by integrating the signal over time. Amplitude and
frequency are more meaningful parameters for measuring continuous emissions,
whilst count rate and energy analysis are useful for burst emission characterization
[10]. A burst is defined as an event that exceeds a certain threshold. For an event, the
features were extracted and analyzed in this part of this study: peak amplitude, up
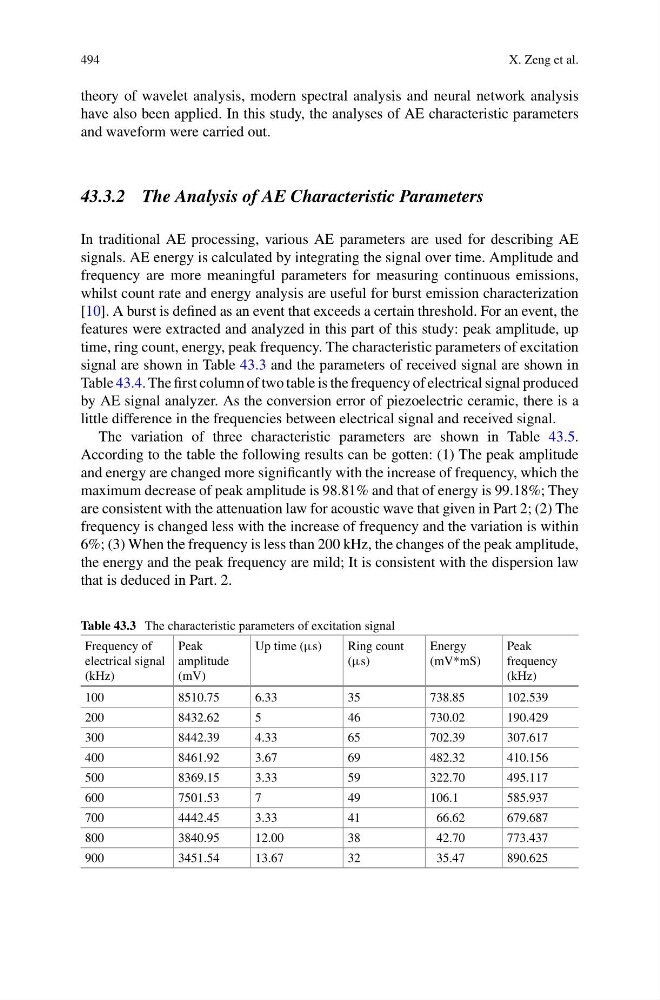
time, ring count, energy, peak frequency. The characteristic parameters of excitation
signal are shown in Table 43.3 and the parameters of received signal are shown in
Table 43.4. The first column of two table is the frequency of electrical signal produced
by AE signal analyzer. As the conversion error of piezoelectric ceramic, there is a
little difference in the frequencies between electrical signal and received signal.
The variation of three characteristic parameters are shown in Table 43.5.
According to the table the following results can be gotten: (1) The peak amplitude
and energy are changed more significantly with the increase of frequency, which the
maximum decrease of peak amplitude is 98.81% and that of energy is 99.18%; They
are consistent with the attenuation law for acoustic wave that given in Part 2; (2) The
frequency is changed less with the increase of frequency and the variation is within
6%; (3) When the frequency is less than 200 kHz, the changes of the peak amplitude,
the energy and the peak frequency are mild; It is consistent with the dispersion law
that is deduced in Part. 2.
Table 43.3 The characteristic parameters of excitation signal
Frequency of
electrical signal
(kHz)
Peak
amplitude
(mV)
Up time (µs)
Ring count
(µs)
Energy
(mV*mS)
Peak
frequency
(kHz)
100
8510.75
6.33
35
738.85
102.539
200
8432.62
5
46
730.02
190.429
300
8442.39
4.33
65
702.39
307.617
400
8461.92
3.67
69
482.32
410.156
500
8369.15
3.33
59
322.70
495.117
600
7501.53
7
49
106.1
585.937
700
4442.45
3.33
41
66.62
679.687
800
3840.95
12.00
38
42.70
773.437
900
3451.54
13.67
32
35.47
890.625
X. Zeng et al.
theory of wavelet analysis, modern spectral analysis and neural network analysis
have also been applied. In this study, the analyses of AE characteristic parameters
and waveform were carried out.
43.3.2 The Analysis of AE Characteristic Parameters
In traditional AE processing, various AE parameters are used for describing AE
signals. AE energy is calculated by integrating the signal over time. Amplitude and
frequency are more meaningful parameters for measuring continuous emissions,
whilst count rate and energy analysis are useful for burst emission characterization
[10]. A burst is defined as an event that exceeds a certain threshold. For an event, the
features were extracted and analyzed in this part of this study: peak amplitude, up
time, ring count, energy, peak frequency. The characteristic parameters of excitation
signal are shown in Table 43.3 and the parameters of received signal are shown in
Table 43.4. The first column of two table is the frequency of electrical signal produced
by AE signal analyzer. As the conversion error of piezoelectric ceramic, there is a
little difference in the frequencies between electrical signal and received signal.
The variation of three characteristic parameters are shown in Table 43.5.
According to the table the following results can be gotten: (1) The peak amplitude
and energy are changed more significantly with the increase of frequency, which the
maximum decrease of peak amplitude is 98.81% and that of energy is 99.18%; They
are consistent with the attenuation law for acoustic wave that given in Part 2; (2) The
frequency is changed less with the increase of frequency and the variation is within
6%; (3) When the frequency is less than 200 kHz, the changes of the peak amplitude,
the energy and the peak frequency are mild; It is consistent with the dispersion law
that is deduced in Part. 2.
Table 43.3 The characteristic parameters of excitation signal
Frequency of
electrical signal
(kHz)
Peak
amplitude
(mV)
Up time (µs)
Ring count
(µs)
Energy
(mV*mS)
Peak
frequency
(kHz)
100
8510.75
6.33
35
738.85
102.539
200
8432.62
5
46
730.02
190.429
300
8442.39
4.33
65
702.39
307.617
400
8461.92
3.67
69
482.32
410.156
500
8369.15
3.33
59
322.70
495.117
600
7501.53
7
49
106.1
585.937
700
4442.45
3.33
41
66.62
679.687
800
3840.95
12.00
38
42.70
773.437
900
3451.54
13.67
32
35.47
890.625