

492
X. Zeng et al.
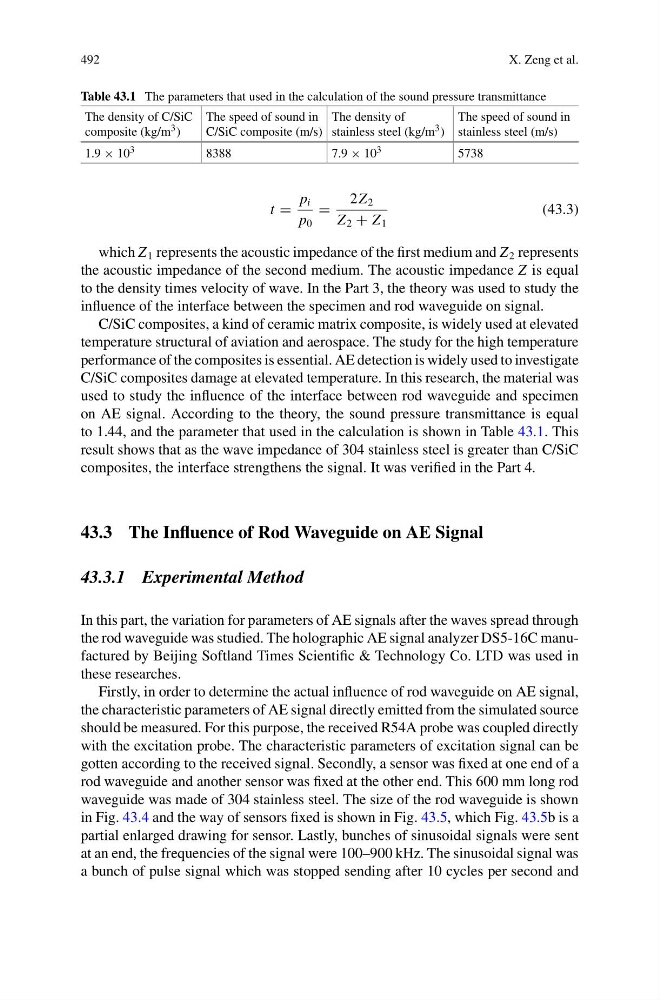
Table 43.1 The parameters that used in the calculation of the sound pressure transmittance
The density of C/SiC
composite (kg/m 3 )
The speed of sound in
C/SiC composite (m/s)
The density of
stainless steel (kg/m 3 )
The speed of sound in
stainless steel (m/s)
1.9 × 10 3
8388
7.9 × 10 3
5738
t =
p i
p 0
=
2Z 2
Z 2 + Z 1
(43.3)
which Z 1 represents the acoustic impedance of the first medium and Z 2 represents
the acoustic impedance of the second medium. The acoustic impedance Z is equal
to the density times velocity of wave. In the Part 3, the theory was used to study the
influence of the interface between the specimen and rod waveguide on signal.
C/SiC composites, a kind of ceramic matrix composite, is widely used at elevated
temperature structural of aviation and aerospace. The study for the high temperature
performance of the composites is essential. AE detection is widely used to investigate
C/SiC composites damage at elevated temperature. In this research, the material was
used to study the influence of the interface between rod waveguide and specimen
on AE signal. According to the theory, the sound pressure transmittance is equal
to 1.44, and the parameter that used in the calculation is shown in Table 43.1. This
result shows that as the wave impedance of 304 stainless steel is greater than C/SiC
composites, the interface strengthens the signal. It was verified in the Part 4.
43.3 The Influence of Rod Waveguide on AE Signal
43.3.1 Experimental Method
In this part, the variation for parameters of AE signals after the waves spread through
the rod waveguide was studied. The holographic AE signal analyzer DS5-16C manufactured by Beijing Softland Times Scientific & Technology Co. LTD was used in
these researches.
Firstly, in order to determine the actual influence of rod waveguide on AE signal,
the characteristic parameters of AE signal directly emitted from the simulated source
should be measured. For this purpose, the received R54A probe was coupled directly
with the excitation probe. The characteristic parameters of excitation signal can be
gotten according to the received signal. Secondly, a sensor was fixed at one end of a
rod waveguide and another sensor was fixed at the other end. This 600 mm long rod
waveguide was made of 304 stainless steel. The size of the rod waveguide is shown
in Fig. 43.4 and the way of sensors fixed is shown in Fig. 43.5, which Fig. 43.5b is a
partial enlarged drawing for sensor. Lastly, bunches of sinusoidal signals were sent
at an end, the frequencies of the signal were 100–900 kHz. The sinusoidal signal was
a bunch of pulse signal which was stopped sending after 10 cycles per second and
X. Zeng et al.
Table 43.1 The parameters that used in the calculation of the sound pressure transmittance
The density of C/SiC
composite (kg/m 3 )
The speed of sound in
C/SiC composite (m/s)
The density of
stainless steel (kg/m 3 )
The speed of sound in
stainless steel (m/s)
1.9 × 10 3
8388
7.9 × 10 3
5738
t =
p i
p 0
=
2Z 2
Z 2 + Z 1
(43.3)
which Z 1 represents the acoustic impedance of the first medium and Z 2 represents
the acoustic impedance of the second medium. The acoustic impedance Z is equal
to the density times velocity of wave. In the Part 3, the theory was used to study the
influence of the interface between the specimen and rod waveguide on signal.
C/SiC composites, a kind of ceramic matrix composite, is widely used at elevated
temperature structural of aviation and aerospace. The study for the high temperature
performance of the composites is essential. AE detection is widely used to investigate
C/SiC composites damage at elevated temperature. In this research, the material was
used to study the influence of the interface between rod waveguide and specimen
on AE signal. According to the theory, the sound pressure transmittance is equal
to 1.44, and the parameter that used in the calculation is shown in Table 43.1. This
result shows that as the wave impedance of 304 stainless steel is greater than C/SiC
composites, the interface strengthens the signal. It was verified in the Part 4.
43.3 The Influence of Rod Waveguide on AE Signal
43.3.1 Experimental Method
In this part, the variation for parameters of AE signals after the waves spread through
the rod waveguide was studied. The holographic AE signal analyzer DS5-16C manufactured by Beijing Softland Times Scientific & Technology Co. LTD was used in
these researches.
Firstly, in order to determine the actual influence of rod waveguide on AE signal,
the characteristic parameters of AE signal directly emitted from the simulated source
should be measured. For this purpose, the received R54A probe was coupled directly
with the excitation probe. The characteristic parameters of excitation signal can be
gotten according to the received signal. Secondly, a sensor was fixed at one end of a
rod waveguide and another sensor was fixed at the other end. This 600 mm long rod
waveguide was made of 304 stainless steel. The size of the rod waveguide is shown
in Fig. 43.4 and the way of sensors fixed is shown in Fig. 43.5, which Fig. 43.5b is a
partial enlarged drawing for sensor. Lastly, bunches of sinusoidal signals were sent
at an end, the frequencies of the signal were 100–900 kHz. The sinusoidal signal was
a bunch of pulse signal which was stopped sending after 10 cycles per second and