

478
K. Zhang et al.
Table 42.1 Experimental
results of debris cloud impact
Experiment Impact velocity
(km/s)
D 99 (mm) Damage mode
No. 1
2.50
102
NP
No. 2
3.05
126
P
No. 3
3.65
133
NP
No. 4
4.00
152
NP
No. 5
4.45
159
NP
No. 6
5.05
165
NP
The point 3 shows the point with the outermost radial direction of the debris cloud,
which has the normal velocity v 3a and the radial velocity v 3d parallel to the target
plate. The damage area in rear plate can be broadly classified into three areas: the
central cratered area (D cc ), the ring cratered area (D rc ), and the spray area (D 99 ), as
interpreted in Fig. 42.2b [14].
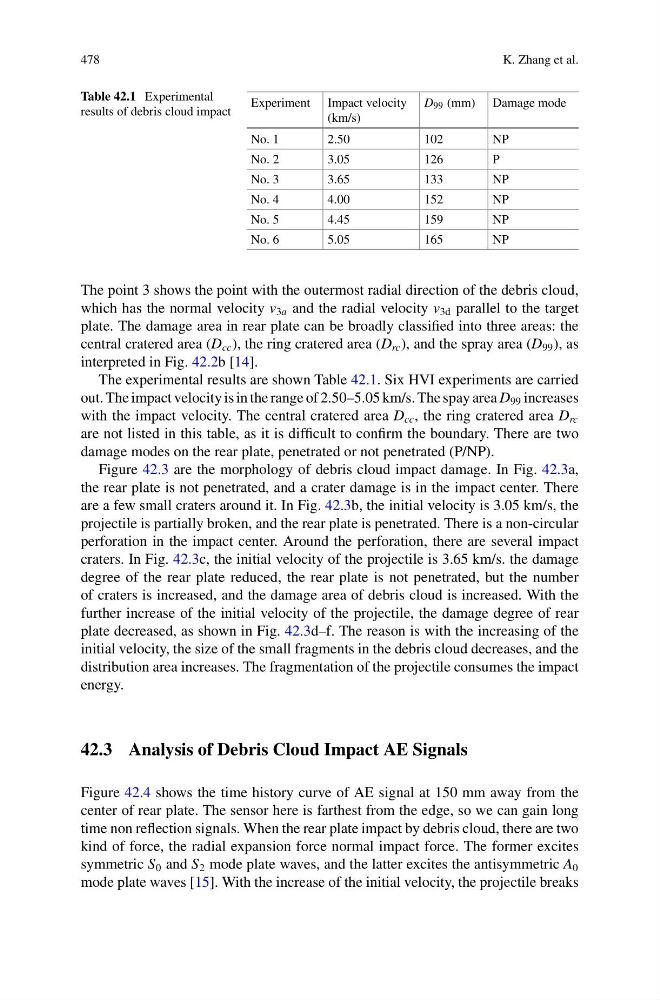
The experimental results are shown Table 42.1. Six HVI experiments are carried
out. The impact velocity is in the range of 2.50–5.05 km/s. The spay area D 99 increases
with the impact velocity. The central cratered area D cc , the ring cratered area D rc
are not listed in this table, as it is difficult to confirm the boundary. There are two
damage modes on the rear plate, penetrated or not penetrated (P/NP).
Figure 42.3 are the morphology of debris cloud impact damage. In Fig. 42.3a,
the rear plate is not penetrated, and a crater damage is in the impact center. There
are a few small craters around it. In Fig. 42.3b, the initial velocity is 3.05 km/s, the
projectile is partially broken, and the rear plate is penetrated. There is a non-circular
perforation in the impact center. Around the perforation, there are several impact
craters. In Fig. 42.3c, the initial velocity of the projectile is 3.65 km/s. the damage
degree of the rear plate reduced, the rear plate is not penetrated, but the number
of craters is increased, and the damage area of debris cloud is increased. With the
further increase of the initial velocity of the projectile, the damage degree of rear
plate decreased, as shown in Fig. 42.3d–f. The reason is with the increasing of the
initial velocity, the size of the small fragments in the debris cloud decreases, and the
distribution area increases. The fragmentation of the projectile consumes the impact
energy.
42.3 Analysis of Debris Cloud Impact AE Signals
Figure 42.4 shows the time history curve of AE signal at 150 mm away from the
center of rear plate. The sensor here is farthest from the edge, so we can gain long
time non reflection signals. When the rear plate impact by debris cloud, there are two
kind of force, the radial expansion force normal impact force. The former excites
symmetric S 0 and S 2 mode plate waves, and the latter excites the antisymmetric A 0
mode plate waves [15]. With the increase of the initial velocity, the projectile breaks
K. Zhang et al.
Table 42.1 Experimental
results of debris cloud impact
Experiment Impact velocity
(km/s)
D 99 (mm) Damage mode
No. 1
2.50
102
NP
No. 2
3.05
126
P
No. 3
3.65
133
NP
No. 4
4.00
152
NP
No. 5
4.45
159
NP
No. 6
5.05
165
NP
The point 3 shows the point with the outermost radial direction of the debris cloud,
which has the normal velocity v 3a and the radial velocity v 3d parallel to the target
plate. The damage area in rear plate can be broadly classified into three areas: the
central cratered area (D cc ), the ring cratered area (D rc ), and the spray area (D 99 ), as
interpreted in Fig. 42.2b [14].
The experimental results are shown Table 42.1. Six HVI experiments are carried
out. The impact velocity is in the range of 2.50–5.05 km/s. The spay area D 99 increases
with the impact velocity. The central cratered area D cc , the ring cratered area D rc
are not listed in this table, as it is difficult to confirm the boundary. There are two
damage modes on the rear plate, penetrated or not penetrated (P/NP).
Figure 42.3 are the morphology of debris cloud impact damage. In Fig. 42.3a,
the rear plate is not penetrated, and a crater damage is in the impact center. There
are a few small craters around it. In Fig. 42.3b, the initial velocity is 3.05 km/s, the
projectile is partially broken, and the rear plate is penetrated. There is a non-circular
perforation in the impact center. Around the perforation, there are several impact
craters. In Fig. 42.3c, the initial velocity of the projectile is 3.65 km/s. the damage
degree of the rear plate reduced, the rear plate is not penetrated, but the number
of craters is increased, and the damage area of debris cloud is increased. With the
further increase of the initial velocity of the projectile, the damage degree of rear
plate decreased, as shown in Fig. 42.3d–f. The reason is with the increasing of the
initial velocity, the size of the small fragments in the debris cloud decreases, and the
distribution area increases. The fragmentation of the projectile consumes the impact
energy.
42.3 Analysis of Debris Cloud Impact AE Signals
Figure 42.4 shows the time history curve of AE signal at 150 mm away from the
center of rear plate. The sensor here is farthest from the edge, so we can gain long
time non reflection signals. When the rear plate impact by debris cloud, there are two
kind of force, the radial expansion force normal impact force. The former excites
symmetric S 0 and S 2 mode plate waves, and the latter excites the antisymmetric A 0
mode plate waves [15]. With the increase of the initial velocity, the projectile breaks