

41 Study of Acoustic Emission Response to Vortex …
473
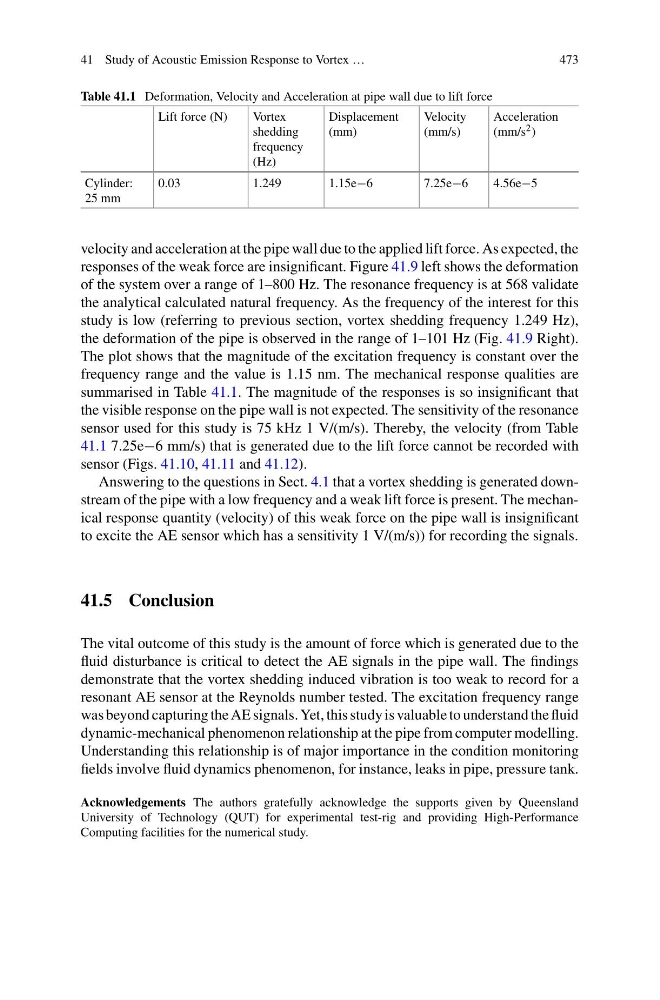
Table 41.1 Deformation, Velocity and Acceleration at pipe wall due to lift force
Lift force (N)
Vortex
shedding
frequency
(Hz)
Displacement
(mm)
Velocity
(mm/s)
Acceleration
(mm/s 2 )
Cylinder:
25 mm
0.03
1.249
1.15e−6
7.25e−6
4.56e−5
velocity and acceleration at the pipe wall due to the applied lift force. As expected, the
responses of the weak force are insignificant. Figure 41.9 left shows the deformation
of the system over a range of 1–800 Hz. The resonance frequency is at 568 validate
the analytical calculated natural frequency. As the frequency of the interest for this
study is low (referring to previous section, vortex shedding frequency 1.249 Hz),
the deformation of the pipe is observed in the range of 1–101 Hz (Fig. 41.9 Right).
The plot shows that the magnitude of the excitation frequency is constant over the
frequency range and the value is 1.15 nm. The mechanical response qualities are
summarised in Table 41.1. The magnitude of the responses is so insignificant that
the visible response on the pipe wall is not expected. The sensitivity of the resonance
sensor used for this study is 75 kHz 1 V/(m/s). Thereby, the velocity (from Table
41.1 7.25e−6 mm/s) that is generated due to the lift force cannot be recorded with
sensor (Figs. 41.10, 41.11 and 41.12).
Answering to the questions in Sect. 4.1 that a vortex shedding is generated downstream of the pipe with a low frequency and a weak lift force is present. The mechanical response quantity (velocity) of this weak force on the pipe wall is insignificant
to excite the AE sensor which has a sensitivity 1 V/(m/s)) for recording the signals.
41.5 Conclusion
The vital outcome of this study is the amount of force which is generated due to the
fluid disturbance is critical to detect the AE signals in the pipe wall. The findings
demonstrate that the vortex shedding induced vibration is too weak to record for a
resonant AE sensor at the Reynolds number tested. The excitation frequency range
was beyond capturing the AE signals. Yet, this study is valuable to understand the fluid
dynamic-mechanical phenomenon relationship at the pipe from computer modelling.
Understanding this relationship is of major importance in the condition monitoring
fields involve fluid dynamics phenomenon, for instance, leaks in pipe, pressure tank.
Acknowledgements The authors gratefully acknowledge the supports given by Queensland
University of Technology (QUT) for experimental test-rig and providing High-Performance
Computing facilities for the numerical study.
473
Table 41.1 Deformation, Velocity and Acceleration at pipe wall due to lift force
Lift force (N)
Vortex
shedding
frequency
(Hz)
Displacement
(mm)
Velocity
(mm/s)
Acceleration
(mm/s 2 )
Cylinder:
25 mm
0.03
1.249
1.15e−6
7.25e−6
4.56e−5
velocity and acceleration at the pipe wall due to the applied lift force. As expected, the
responses of the weak force are insignificant. Figure 41.9 left shows the deformation
of the system over a range of 1–800 Hz. The resonance frequency is at 568 validate
the analytical calculated natural frequency. As the frequency of the interest for this
study is low (referring to previous section, vortex shedding frequency 1.249 Hz),
the deformation of the pipe is observed in the range of 1–101 Hz (Fig. 41.9 Right).
The plot shows that the magnitude of the excitation frequency is constant over the
frequency range and the value is 1.15 nm. The mechanical response qualities are
summarised in Table 41.1. The magnitude of the responses is so insignificant that
the visible response on the pipe wall is not expected. The sensitivity of the resonance
sensor used for this study is 75 kHz 1 V/(m/s). Thereby, the velocity (from Table
41.1 7.25e−6 mm/s) that is generated due to the lift force cannot be recorded with
sensor (Figs. 41.10, 41.11 and 41.12).
Answering to the questions in Sect. 4.1 that a vortex shedding is generated downstream of the pipe with a low frequency and a weak lift force is present. The mechanical response quantity (velocity) of this weak force on the pipe wall is insignificant
to excite the AE sensor which has a sensitivity 1 V/(m/s)) for recording the signals.
41.5 Conclusion
The vital outcome of this study is the amount of force which is generated due to the
fluid disturbance is critical to detect the AE signals in the pipe wall. The findings
demonstrate that the vortex shedding induced vibration is too weak to record for a
resonant AE sensor at the Reynolds number tested. The excitation frequency range
was beyond capturing the AE signals. Yet, this study is valuable to understand the fluid
dynamic-mechanical phenomenon relationship at the pipe from computer modelling.
Understanding this relationship is of major importance in the condition monitoring
fields involve fluid dynamics phenomenon, for instance, leaks in pipe, pressure tank.
Acknowledgements The authors gratefully acknowledge the supports given by Queensland
University of Technology (QUT) for experimental test-rig and providing High-Performance
Computing facilities for the numerical study.