

472
F. Zohora et al.
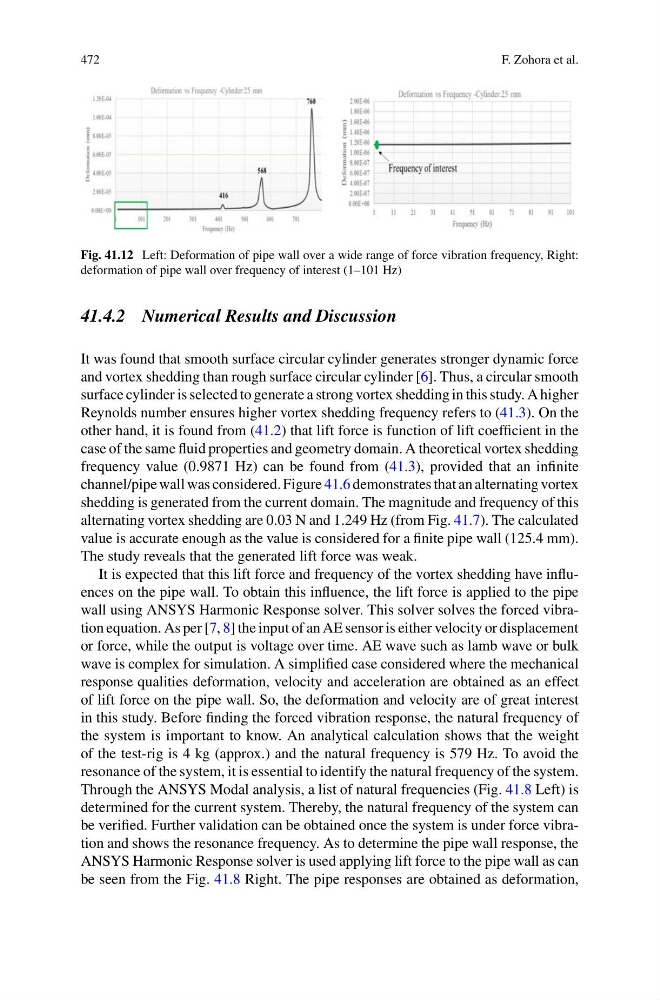
Fig. 41.12 Left: Deformation of pipe wall over a wide range of force vibration frequency, Right:
deformation of pipe wall over frequency of interest (1–101 Hz)
41.4.2 Numerical Results and Discussion
It was found that smooth surface circular cylinder generates stronger dynamic force
and vortex shedding than rough surface circular cylinder [6]. Thus, a circular smooth
surface cylinder is selected to generate a strong vortex shedding in this study. A higher
Reynolds number ensures higher vortex shedding frequency refers to (41.3). On the
other hand, it is found from (41.2) that lift force is function of lift coefficient in the
case of the same fluid properties and geometry domain. A theoretical vortex shedding
frequency value (0.9871 Hz) can be found from (41.3), provided that an infinite
channel/pipe wall was considered. Figure 41.6 demonstrates that an alternating vortex
shedding is generated from the current domain. The magnitude and frequency of this
alternating vortex shedding are 0.03 N and 1.249 Hz (from Fig. 41.7). The calculated
value is accurate enough as the value is considered for a finite pipe wall (125.4 mm).
The study reveals that the generated lift force was weak.
It is expected that this lift force and frequency of the vortex shedding have influences on the pipe wall. To obtain this influence, the lift force is applied to the pipe
wall using ANSYS Harmonic Response solver. This solver solves the forced vibration equation. As per [7, 8] the input of an AE sensor is either velocity or displacement
or force, while the output is voltage over time. AE wave such as lamb wave or bulk
wave is complex for simulation. A simplified case considered where the mechanical
response qualities deformation, velocity and acceleration are obtained as an effect
of lift force on the pipe wall. So, the deformation and velocity are of great interest
in this study. Before finding the forced vibration response, the natural frequency of
the system is important to know. An analytical calculation shows that the weight
of the test-rig is 4 kg (approx.) and the natural frequency is 579 Hz. To avoid the
resonance of the system, it is essential to identify the natural frequency of the system.
Through the ANSYS Modal analysis, a list of natural frequencies (Fig. 41.8 Left) is
determined for the current system. Thereby, the natural frequency of the system can
be verified. Further validation can be obtained once the system is under force vibration and shows the resonance frequency. As to determine the pipe wall response, the
ANSYS Harmonic Response solver is used applying lift force to the pipe wall as can
be seen from the Fig. 41.8 Right. The pipe responses are obtained as deformation,
F. Zohora et al.
Fig. 41.12 Left: Deformation of pipe wall over a wide range of force vibration frequency, Right:
deformation of pipe wall over frequency of interest (1–101 Hz)
41.4.2 Numerical Results and Discussion
It was found that smooth surface circular cylinder generates stronger dynamic force
and vortex shedding than rough surface circular cylinder [6]. Thus, a circular smooth
surface cylinder is selected to generate a strong vortex shedding in this study. A higher
Reynolds number ensures higher vortex shedding frequency refers to (41.3). On the
other hand, it is found from (41.2) that lift force is function of lift coefficient in the
case of the same fluid properties and geometry domain. A theoretical vortex shedding
frequency value (0.9871 Hz) can be found from (41.3), provided that an infinite
channel/pipe wall was considered. Figure 41.6 demonstrates that an alternating vortex
shedding is generated from the current domain. The magnitude and frequency of this
alternating vortex shedding are 0.03 N and 1.249 Hz (from Fig. 41.7). The calculated
value is accurate enough as the value is considered for a finite pipe wall (125.4 mm).
The study reveals that the generated lift force was weak.
It is expected that this lift force and frequency of the vortex shedding have influences on the pipe wall. To obtain this influence, the lift force is applied to the pipe
wall using ANSYS Harmonic Response solver. This solver solves the forced vibration equation. As per [7, 8] the input of an AE sensor is either velocity or displacement
or force, while the output is voltage over time. AE wave such as lamb wave or bulk
wave is complex for simulation. A simplified case considered where the mechanical
response qualities deformation, velocity and acceleration are obtained as an effect
of lift force on the pipe wall. So, the deformation and velocity are of great interest
in this study. Before finding the forced vibration response, the natural frequency of
the system is important to know. An analytical calculation shows that the weight
of the test-rig is 4 kg (approx.) and the natural frequency is 579 Hz. To avoid the
resonance of the system, it is essential to identify the natural frequency of the system.
Through the ANSYS Modal analysis, a list of natural frequencies (Fig. 41.8 Left) is
determined for the current system. Thereby, the natural frequency of the system can
be verified. Further validation can be obtained once the system is under force vibration and shows the resonance frequency. As to determine the pipe wall response, the
ANSYS Harmonic Response solver is used applying lift force to the pipe wall as can
be seen from the Fig. 41.8 Right. The pipe responses are obtained as deformation,