

446
X. Li et al.
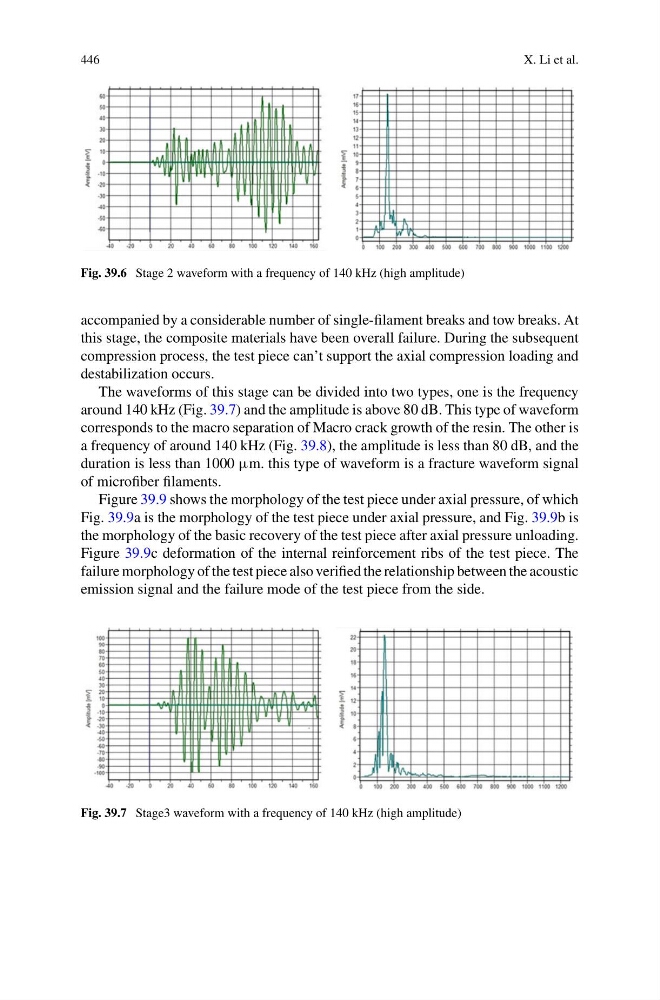
Fig. 39.6 Stage 2 waveform with a frequency of 140 kHz (high amplitude)
accompanied by a considerable number of single-filament breaks and tow breaks. At
this stage, the composite materials have been overall failure. During the subsequent
compression process, the test piece can’t support the axial compression loading and
destabilization occurs.
The waveforms of this stage can be divided into two types, one is the frequency
around 140 kHz (Fig. 39.7) and the amplitude is above 80 dB. This type of waveform
corresponds to the macro separation of Macro crack growth of the resin. The other is
a frequency of around 140 kHz (Fig. 39.8), the amplitude is less than 80 dB, and the
duration is less than 1000 µm. this type of waveform is a fracture waveform signal
of microfiber filaments.
Figure 39.9 shows the morphology of the test piece under axial pressure, of which
Fig. 39.9a is the morphology of the test piece under axial pressure, and Fig. 39.9b is
the morphology of the basic recovery of the test piece after axial pressure unloading.
Figure 39.9c deformation of the internal reinforcement ribs of the test piece. The
failure morphology of the test piece also verified the relationship between the acoustic
emission signal and the failure mode of the test piece from the side.
Fig. 39.7 Stage3 waveform with a frequency of 140 kHz (high amplitude)
X. Li et al.
Fig. 39.6 Stage 2 waveform with a frequency of 140 kHz (high amplitude)
accompanied by a considerable number of single-filament breaks and tow breaks. At
this stage, the composite materials have been overall failure. During the subsequent
compression process, the test piece can’t support the axial compression loading and
destabilization occurs.
The waveforms of this stage can be divided into two types, one is the frequency
around 140 kHz (Fig. 39.7) and the amplitude is above 80 dB. This type of waveform
corresponds to the macro separation of Macro crack growth of the resin. The other is
a frequency of around 140 kHz (Fig. 39.8), the amplitude is less than 80 dB, and the
duration is less than 1000 µm. this type of waveform is a fracture waveform signal
of microfiber filaments.
Figure 39.9 shows the morphology of the test piece under axial pressure, of which
Fig. 39.9a is the morphology of the test piece under axial pressure, and Fig. 39.9b is
the morphology of the basic recovery of the test piece after axial pressure unloading.
Figure 39.9c deformation of the internal reinforcement ribs of the test piece. The
failure morphology of the test piece also verified the relationship between the acoustic
emission signal and the failure mode of the test piece from the side.
Fig. 39.7 Stage3 waveform with a frequency of 140 kHz (high amplitude)