

39 Study on AE Detection Signal of Composite Barrel Under …
445
number is relatively small. It is preliminarily judged that such waveforms should be
the fracture waveform signals of individual microfiber filaments.
The second stage (198–240 s), this stage is the loading stage 6 and 7 of the axial
compression test. During the loading stage 7. It can be seen from the AE process
diagram that the hits at this stage has begun to increase, and the amplitude of this
stage has increased significantly. During the loading process, the amplitude value
of the AE signal has been increasing. The amplitude of individual signals reaches
100 dB, but during the loading process, the amplitude value returns to below 60 dB.
Comparing the duration process chart, we can see that the duration of AE signal
with amplitude above 80 dB is also relatively large. It is preliminary judged that
during this process, obvious damage occurred in the test piece, but the damage did
not expand with the progress of the load. According to the reference given in [6], it
shows that high amplitude (>80 dB) signals are more related to fiber damage modes,
while medium amplitude signals (60–80 dB) may be related to interface damage, and
low amplitude signals (<60 dB) are related to substrate damage. this process should
be a macro separation of the interface and resin macro crack growth.
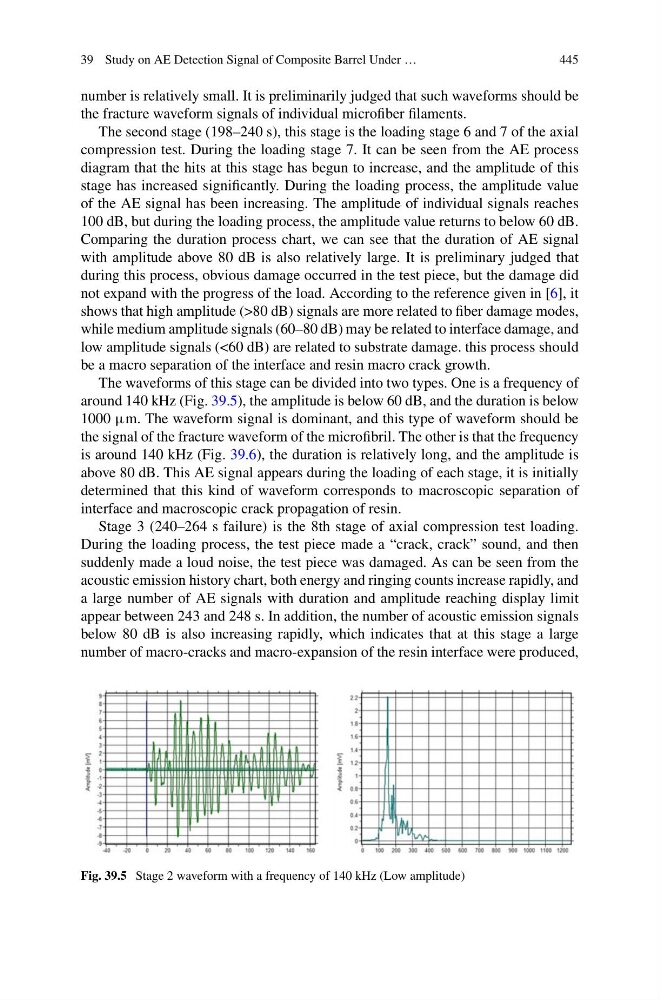
The waveforms of this stage can be divided into two types. One is a frequency of
around 140 kHz (Fig. 39.5), the amplitude is below 60 dB, and the duration is below
1000 µm. The waveform signal is dominant, and this type of waveform should be
the signal of the fracture waveform of the microfibril. The other is that the frequency
is around 140 kHz (Fig. 39.6), the duration is relatively long, and the amplitude is
above 80 dB. This AE signal appears during the loading of each stage, it is initially
determined that this kind of waveform corresponds to macroscopic separation of
interface and macroscopic crack propagation of resin.
Stage 3 (240–264 s failure) is the 8th stage of axial compression test loading.
During the loading process, the test piece made a “crack, crack” sound, and then
suddenly made a loud noise, the test piece was damaged. As can be seen from the
acoustic emission history chart, both energy and ringing counts increase rapidly, and
a large number of AE signals with duration and amplitude reaching display limit
appear between 243 and 248 s. In addition, the number of acoustic emission signals
below 80 dB is also increasing rapidly, which indicates that at this stage a large
number of macro-cracks and macro-expansion of the resin interface were produced,
Fig. 39.5 Stage 2 waveform with a frequency of 140 kHz (Low amplitude)
445
number is relatively small. It is preliminarily judged that such waveforms should be
the fracture waveform signals of individual microfiber filaments.
The second stage (198–240 s), this stage is the loading stage 6 and 7 of the axial
compression test. During the loading stage 7. It can be seen from the AE process
diagram that the hits at this stage has begun to increase, and the amplitude of this
stage has increased significantly. During the loading process, the amplitude value
of the AE signal has been increasing. The amplitude of individual signals reaches
100 dB, but during the loading process, the amplitude value returns to below 60 dB.
Comparing the duration process chart, we can see that the duration of AE signal
with amplitude above 80 dB is also relatively large. It is preliminary judged that
during this process, obvious damage occurred in the test piece, but the damage did
not expand with the progress of the load. According to the reference given in [6], it
shows that high amplitude (>80 dB) signals are more related to fiber damage modes,
while medium amplitude signals (60–80 dB) may be related to interface damage, and
low amplitude signals (<60 dB) are related to substrate damage. this process should
be a macro separation of the interface and resin macro crack growth.
The waveforms of this stage can be divided into two types. One is a frequency of
around 140 kHz (Fig. 39.5), the amplitude is below 60 dB, and the duration is below
1000 µm. The waveform signal is dominant, and this type of waveform should be
the signal of the fracture waveform of the microfibril. The other is that the frequency
is around 140 kHz (Fig. 39.6), the duration is relatively long, and the amplitude is
above 80 dB. This AE signal appears during the loading of each stage, it is initially
determined that this kind of waveform corresponds to macroscopic separation of
interface and macroscopic crack propagation of resin.
Stage 3 (240–264 s failure) is the 8th stage of axial compression test loading.
During the loading process, the test piece made a “crack, crack” sound, and then
suddenly made a loud noise, the test piece was damaged. As can be seen from the
acoustic emission history chart, both energy and ringing counts increase rapidly, and
a large number of AE signals with duration and amplitude reaching display limit
appear between 243 and 248 s. In addition, the number of acoustic emission signals
below 80 dB is also increasing rapidly, which indicates that at this stage a large
number of macro-cracks and macro-expansion of the resin interface were produced,
Fig. 39.5 Stage 2 waveform with a frequency of 140 kHz (Low amplitude)