

424
Q. Lei et al.
10
20
30
10
-10
-20
-30
-40
50
-50
-50
-40
-30
-20
-10
20
30
40
50
40
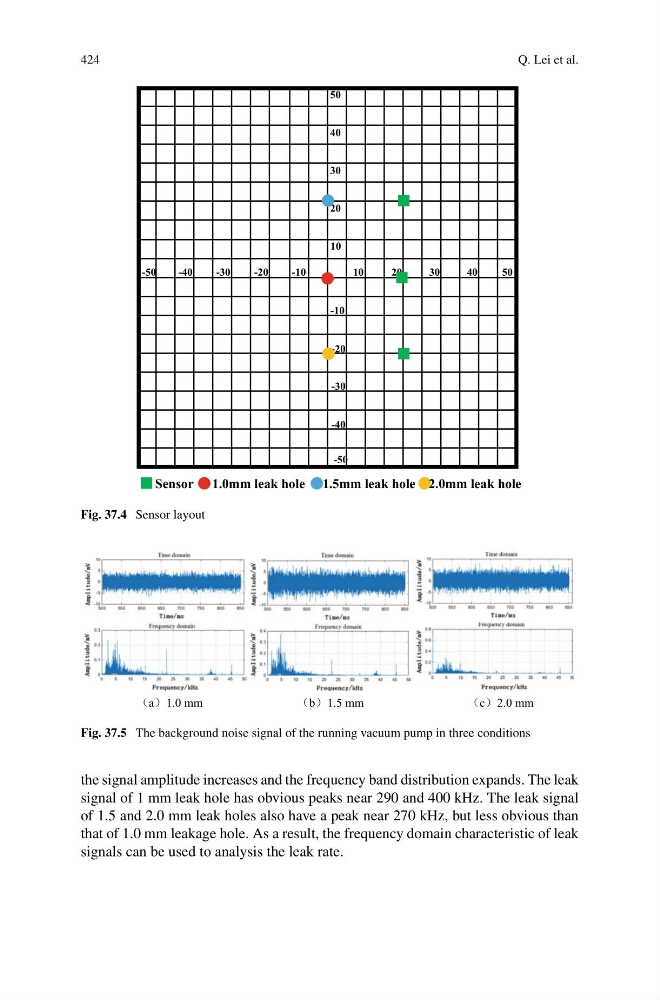
Sensor 1.0mm leak hole 1.5mm leak hole 2.0mm leak hole
Fig. 37.4 Sensor layout
a 1.0 mm
b 1.5 mm
c 2.0 mm
Fig. 37.5 The background noise signal of the running vacuum pump in three conditions
the signal amplitude increases and the frequency band distribution expands. The leak
signal of 1 mm leak hole has obvious peaks near 290 and 400 kHz. The leak signal
of 1.5 and 2.0 mm leak holes also have a peak near 270 kHz, but less obvious than
that of 1.0 mm leakage hole. As a result, the frequency domain characteristic of leak
signals can be used to analysis the leak rate.
Q. Lei et al.
10
20
30
10
-10
-20
-30
-40
50
-50
-50
-40
-30
-20
-10
20
30
40
50
40
Sensor 1.0mm leak hole 1.5mm leak hole 2.0mm leak hole
Fig. 37.4 Sensor layout
a 1.0 mm
b 1.5 mm
c 2.0 mm
Fig. 37.5 The background noise signal of the running vacuum pump in three conditions
the signal amplitude increases and the frequency band distribution expands. The leak
signal of 1 mm leak hole has obvious peaks near 290 and 400 kHz. The leak signal
of 1.5 and 2.0 mm leak holes also have a peak near 270 kHz, but less obvious than
that of 1.0 mm leakage hole. As a result, the frequency domain characteristic of leak
signals can be used to analysis the leak rate.