

394
Y. Liu et al.
been also found in the hoop-wrapped composite cylinders. Usually, after the certain
cycle of filling, the metal lining may be broken or even leaked, and after a certain
use and wear, the wound layer may have a series of damages. So these damages lead
to limit the life of hoop-wrapped composite cylinders. Meanwhile, there is currently
no means to detect the hoop-wrapped composite cylinders.
Acoustic emission (AE) which have advantages of dynamic testing, testing
without material restrictions and high sensitivity, can be monitored in real time with
equipment in use. Experimental study on acoustic emission of composite pressure
vessels at home and abroad is in progress [3]. It can be concluded that it is feasible to
evaluate AE as a dynamic evaluation method for hoop-wrapped composite pressure
vessels. In the evaluation, the damaged of the hoop-wrapped composite cylinders will
release the transient elastic wave when it is loaded, meanwhile the sensors receives
and analyzes the parametric characteristics of the elastic wave to evaluate the activity
of the defect. The time difference of the waveform received by the sensors can be
used to locate the defect. Therefore researches of the acoustic emission signals characteristics of the hoop-wrapped composite cylinders which are running are necessary
to improve the safety of CNG vehicles.
34.2 Fatigue Experiment
34.2.1 Fatigue Experiment in Liner
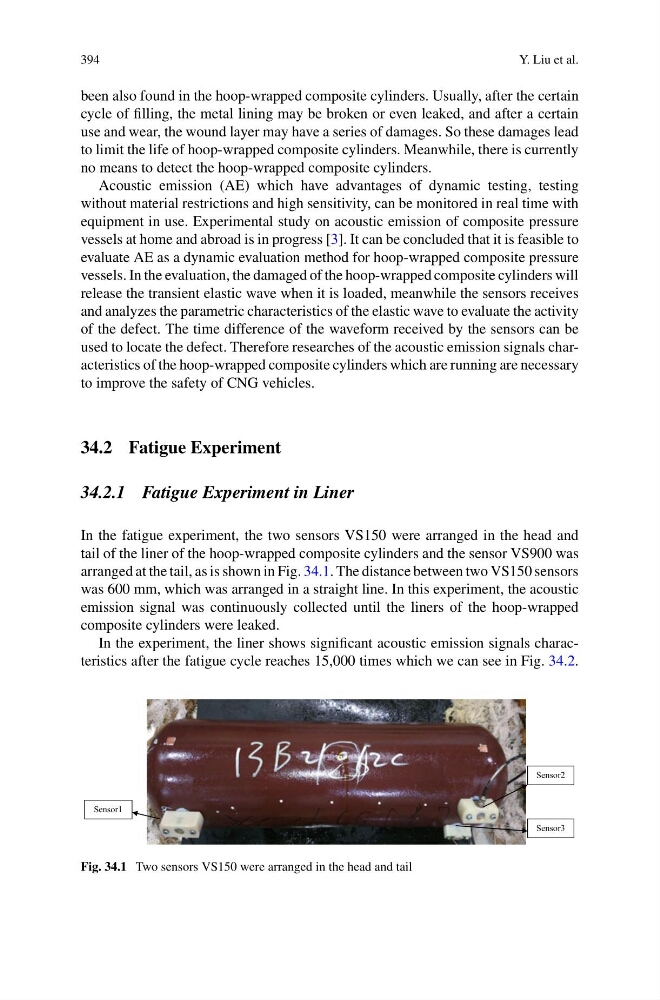
In the fatigue experiment, the two sensors VS150 were arranged in the head and
tail of the liner of the hoop-wrapped composite cylinders and the sensor VS900 was
arranged at the tail, as is shown in Fig. 34.1. The distance between two VS150 sensors
was 600 mm, which was arranged in a straight line. In this experiment, the acoustic
emission signal was continuously collected until the liners of the hoop-wrapped
composite cylinders were leaked.
In the experiment, the liner shows significant acoustic emission signals characteristics after the fatigue cycle reaches 15,000 times which we can see in Fig. 34.2.
Sensor1
Sensor2
Sensor3
Fig. 34.1 Two sensors VS150 were arranged in the head and tail
Y. Liu et al.
been also found in the hoop-wrapped composite cylinders. Usually, after the certain
cycle of filling, the metal lining may be broken or even leaked, and after a certain
use and wear, the wound layer may have a series of damages. So these damages lead
to limit the life of hoop-wrapped composite cylinders. Meanwhile, there is currently
no means to detect the hoop-wrapped composite cylinders.
Acoustic emission (AE) which have advantages of dynamic testing, testing
without material restrictions and high sensitivity, can be monitored in real time with
equipment in use. Experimental study on acoustic emission of composite pressure
vessels at home and abroad is in progress [3]. It can be concluded that it is feasible to
evaluate AE as a dynamic evaluation method for hoop-wrapped composite pressure
vessels. In the evaluation, the damaged of the hoop-wrapped composite cylinders will
release the transient elastic wave when it is loaded, meanwhile the sensors receives
and analyzes the parametric characteristics of the elastic wave to evaluate the activity
of the defect. The time difference of the waveform received by the sensors can be
used to locate the defect. Therefore researches of the acoustic emission signals characteristics of the hoop-wrapped composite cylinders which are running are necessary
to improve the safety of CNG vehicles.
34.2 Fatigue Experiment
34.2.1 Fatigue Experiment in Liner
In the fatigue experiment, the two sensors VS150 were arranged in the head and
tail of the liner of the hoop-wrapped composite cylinders and the sensor VS900 was
arranged at the tail, as is shown in Fig. 34.1. The distance between two VS150 sensors
was 600 mm, which was arranged in a straight line. In this experiment, the acoustic
emission signal was continuously collected until the liners of the hoop-wrapped
composite cylinders were leaked.
In the experiment, the liner shows significant acoustic emission signals characteristics after the fatigue cycle reaches 15,000 times which we can see in Fig. 34.2.
Sensor1
Sensor2
Sensor3
Fig. 34.1 Two sensors VS150 were arranged in the head and tail