

332
H. Asaue et al.
Fig. 27.7 Comparison of the velocity distribution of RC slab in the dry and infiltration conditions
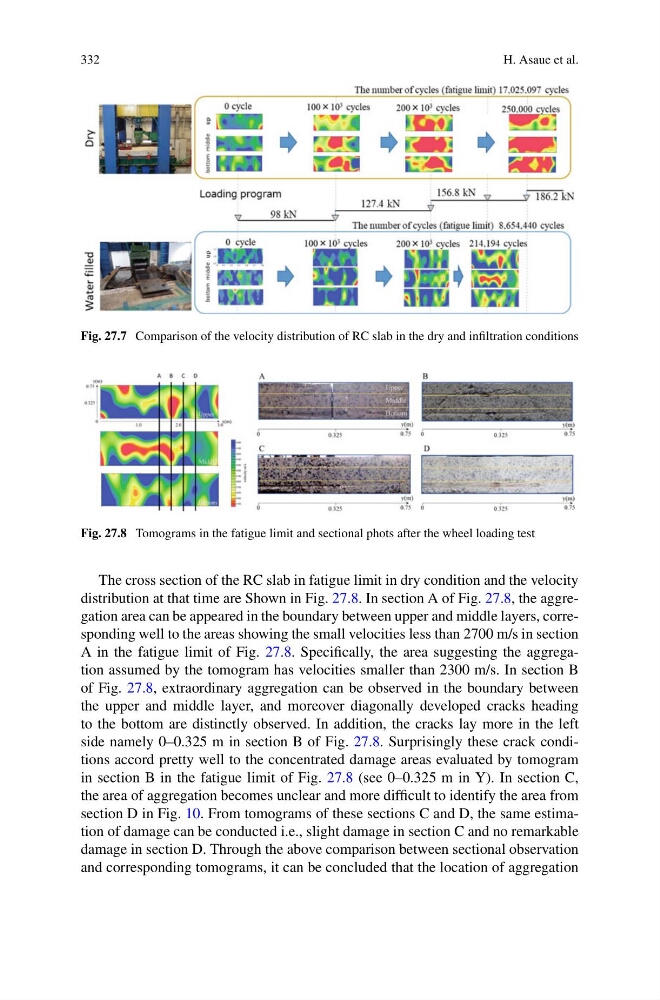
Fig. 27.8 Tomograms in the fatigue limit and sectional phots after the wheel loading test
The cross section of the RC slab in fatigue limit in dry condition and the velocity
distribution at that time are Shown in Fig. 27.8. In section A of Fig. 27.8, the aggregation area can be appeared in the boundary between upper and middle layers, corresponding well to the areas showing the small velocities less than 2700 m/s in section
A in the fatigue limit of Fig. 27.8. Specifically, the area suggesting the aggregation assumed by the tomogram has velocities smaller than 2300 m/s. In section B
of Fig. 27.8, extraordinary aggregation can be observed in the boundary between
the upper and middle layer, and moreover diagonally developed cracks heading
to the bottom are distinctly observed. In addition, the cracks lay more in the left
side namely 0–0.325 m in section B of Fig. 27.8. Surprisingly these crack conditions accord pretty well to the concentrated damage areas evaluated by tomogram
in section B in the fatigue limit of Fig. 27.8 (see 0–0.325 m in Y). In section C,
the area of aggregation becomes unclear and more difficult to identify the area from
section D in Fig. 10. From tomograms of these sections C and D, the same estimation of damage can be conducted i.e., slight damage in section C and no remarkable
damage in section D. Through the above comparison between sectional observation
and corresponding tomograms, it can be concluded that the location of aggregation
H. Asaue et al.
Fig. 27.7 Comparison of the velocity distribution of RC slab in the dry and infiltration conditions
Fig. 27.8 Tomograms in the fatigue limit and sectional phots after the wheel loading test
The cross section of the RC slab in fatigue limit in dry condition and the velocity
distribution at that time are Shown in Fig. 27.8. In section A of Fig. 27.8, the aggregation area can be appeared in the boundary between upper and middle layers, corresponding well to the areas showing the small velocities less than 2700 m/s in section
A in the fatigue limit of Fig. 27.8. Specifically, the area suggesting the aggregation assumed by the tomogram has velocities smaller than 2300 m/s. In section B
of Fig. 27.8, extraordinary aggregation can be observed in the boundary between
the upper and middle layer, and moreover diagonally developed cracks heading
to the bottom are distinctly observed. In addition, the cracks lay more in the left
side namely 0–0.325 m in section B of Fig. 27.8. Surprisingly these crack conditions accord pretty well to the concentrated damage areas evaluated by tomogram
in section B in the fatigue limit of Fig. 27.8 (see 0–0.325 m in Y). In section C,
the area of aggregation becomes unclear and more difficult to identify the area from
section D in Fig. 10. From tomograms of these sections C and D, the same estimation of damage can be conducted i.e., slight damage in section C and no remarkable
damage in section D. Through the above comparison between sectional observation
and corresponding tomograms, it can be concluded that the location of aggregation