

27 Evaluation of Fatigue Damage in RC Slabs Considering Water Infiltration …
331
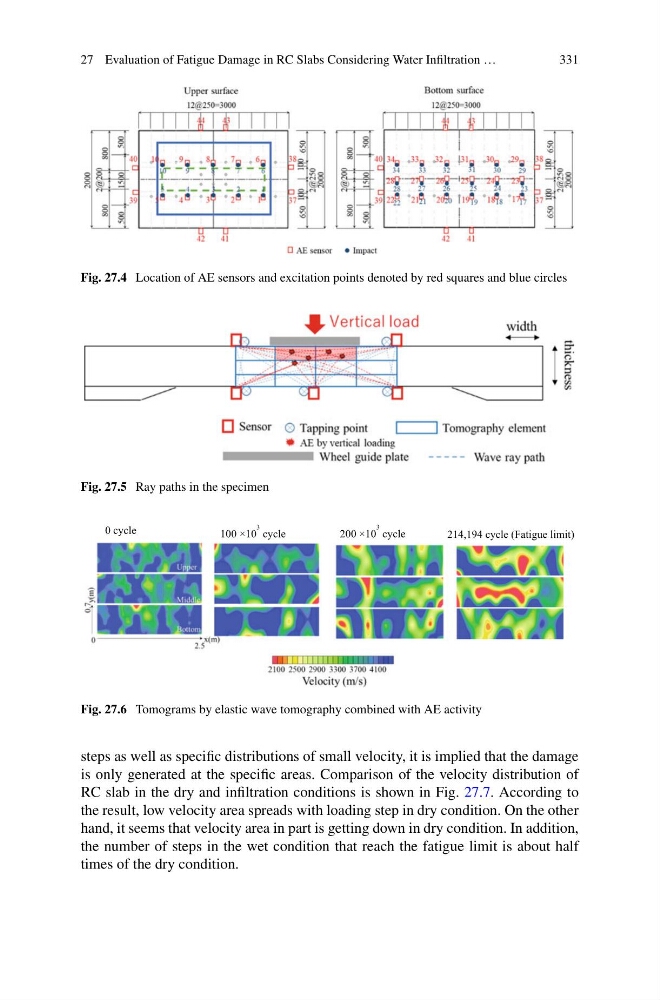
Fig. 27.4 Location of AE sensors and excitation points denoted by red squares and blue circles
Fig. 27.5 Ray paths in the specimen
0 cycle
100 ×10
3 cycle
200 ×10
3 cycle
214,194 cycle (Fatigue limit)
Fig. 27.6 Tomograms by elastic wave tomography combined with AE activity
steps as well as specific distributions of small velocity, it is implied that the damage
is only generated at the specific areas. Comparison of the velocity distribution of
RC slab in the dry and infiltration conditions is shown in Fig. 27.7. According to
the result, low velocity area spreads with loading step in dry condition. On the other
hand, it seems that velocity area in part is getting down in dry condition. In addition,
the number of steps in the wet condition that reach the fatigue limit is about half
times of the dry condition.
331
Fig. 27.4 Location of AE sensors and excitation points denoted by red squares and blue circles
Fig. 27.5 Ray paths in the specimen
0 cycle
100 ×10
3 cycle
200 ×10
3 cycle
214,194 cycle (Fatigue limit)
Fig. 27.6 Tomograms by elastic wave tomography combined with AE activity
steps as well as specific distributions of small velocity, it is implied that the damage
is only generated at the specific areas. Comparison of the velocity distribution of
RC slab in the dry and infiltration conditions is shown in Fig. 27.7. According to
the result, low velocity area spreads with loading step in dry condition. On the other
hand, it seems that velocity area in part is getting down in dry condition. In addition,
the number of steps in the wet condition that reach the fatigue limit is about half
times of the dry condition.