

264
C. Ye et al.
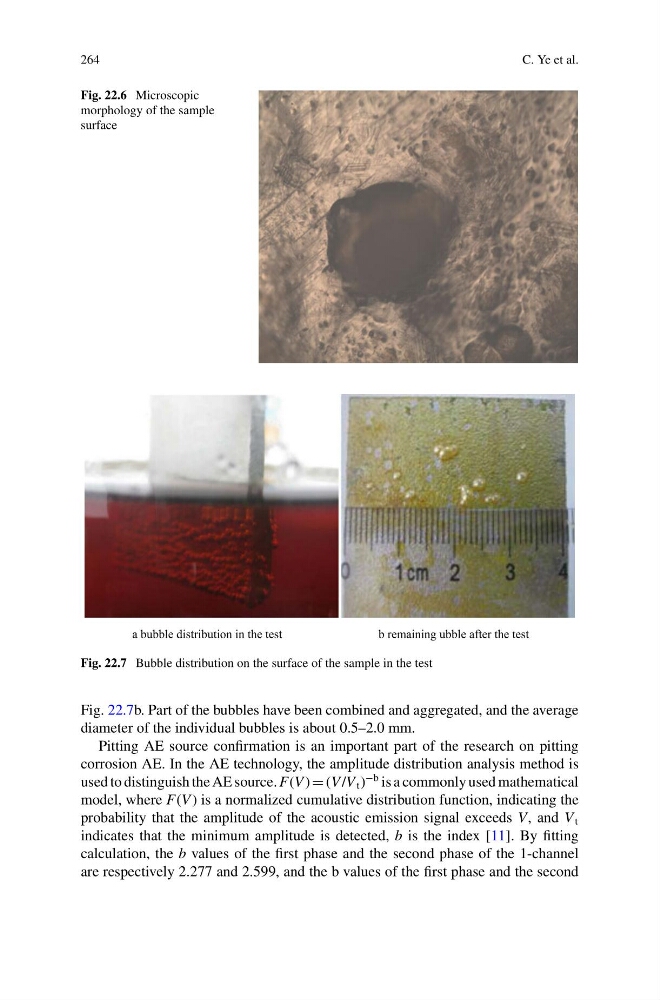
Fig. 22.6 Microscopic
morphology of the sample
surface
Fig. 22.7 Bubble distribution on the surface of the sample in the test
Fig. 22.7b. Part of the bubbles have been combined and aggregated, and the average
diameter of the individual bubbles is about 0.5–2.0 mm.
Pitting AE source confirmation is an important part of the research on pitting
corrosion AE. In the AE technology, the amplitude distribution analysis method is
used to distinguish the AE source. F(V ) = (V /V t )
−b is a commonly used mathematical
model, where F(V ) is a normalized cumulative distribution function, indicating the
probability that the amplitude of the acoustic emission signal exceeds V, and V t
indicates that the minimum amplitude is detected, b is the index [11]. By fitting
calculation, the b values of the first phase and the second phase of the 1-channel
are respectively 2.277 and 2.599, and the b values of the first phase and the second
C. Ye et al.
Fig. 22.6 Microscopic
morphology of the sample
surface
Fig. 22.7 Bubble distribution on the surface of the sample in the test
Fig. 22.7b. Part of the bubbles have been combined and aggregated, and the average
diameter of the individual bubbles is about 0.5–2.0 mm.
Pitting AE source confirmation is an important part of the research on pitting
corrosion AE. In the AE technology, the amplitude distribution analysis method is
used to distinguish the AE source. F(V ) = (V /V t )
−b is a commonly used mathematical
model, where F(V ) is a normalized cumulative distribution function, indicating the
probability that the amplitude of the acoustic emission signal exceeds V, and V t
indicates that the minimum amplitude is detected, b is the index [11]. By fitting
calculation, the b values of the first phase and the second phase of the 1-channel
are respectively 2.277 and 2.599, and the b values of the first phase and the second