

22 Acoustic Emission Monitoring of Pitting Corrosion …
263
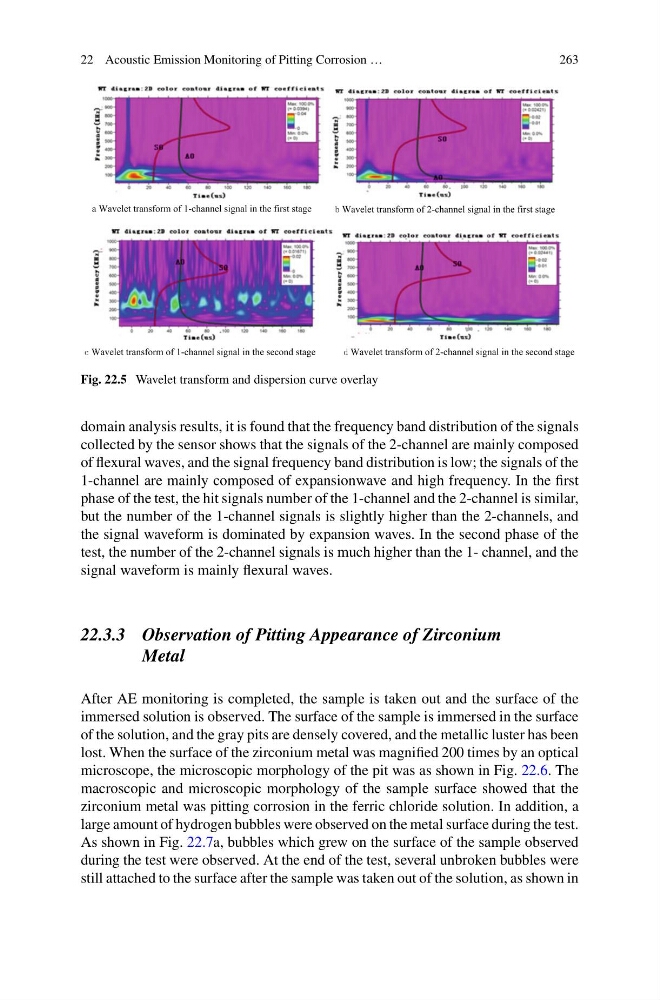
Fig. 22.5 Wavelet transform and dispersion curve overlay
domain analysis results, it is found that the frequency band distribution of the signals
collected by the sensor shows that the signals of the 2-channel are mainly composed
of flexural waves, and the signal frequency band distribution is low; the signals of the
1-channel are mainly composed of expansionwave and high frequency. In the first
phase of the test, the hit signals number of the 1-channel and the 2-channel is similar,
but the number of the 1-channel signals is slightly higher than the 2-channels, and
the signal waveform is dominated by expansion waves. In the second phase of the
test, the number of the 2-channel signals is much higher than the 1- channel, and the
signal waveform is mainly flexural waves.
22.3.3 Observation of Pitting Appearance of Zirconium
Metal
After AE monitoring is completed, the sample is taken out and the surface of the
immersed solution is observed. The surface of the sample is immersed in the surface
of the solution, and the gray pits are densely covered, and the metallic luster has been
lost. When the surface of the zirconium metal was magnified 200 times by an optical
microscope, the microscopic morphology of the pit was as shown in Fig. 22.6. The
macroscopic and microscopic morphology of the sample surface showed that the
zirconium metal was pitting corrosion in the ferric chloride solution. In addition, a
large amount of hydrogen bubbles were observed on the metal surface during the test.
As shown in Fig. 22.7a, bubbles which grew on the surface of the sample observed
during the test were observed. At the end of the test, several unbroken bubbles were
still attached to the surface after the sample was taken out of the solution, as shown in
263
Fig. 22.5 Wavelet transform and dispersion curve overlay
domain analysis results, it is found that the frequency band distribution of the signals
collected by the sensor shows that the signals of the 2-channel are mainly composed
of flexural waves, and the signal frequency band distribution is low; the signals of the
1-channel are mainly composed of expansionwave and high frequency. In the first
phase of the test, the hit signals number of the 1-channel and the 2-channel is similar,
but the number of the 1-channel signals is slightly higher than the 2-channels, and
the signal waveform is dominated by expansion waves. In the second phase of the
test, the number of the 2-channel signals is much higher than the 1- channel, and the
signal waveform is mainly flexural waves.
22.3.3 Observation of Pitting Appearance of Zirconium
Metal
After AE monitoring is completed, the sample is taken out and the surface of the
immersed solution is observed. The surface of the sample is immersed in the surface
of the solution, and the gray pits are densely covered, and the metallic luster has been
lost. When the surface of the zirconium metal was magnified 200 times by an optical
microscope, the microscopic morphology of the pit was as shown in Fig. 22.6. The
macroscopic and microscopic morphology of the sample surface showed that the
zirconium metal was pitting corrosion in the ferric chloride solution. In addition, a
large amount of hydrogen bubbles were observed on the metal surface during the test.
As shown in Fig. 22.7a, bubbles which grew on the surface of the sample observed
during the test were observed. At the end of the test, several unbroken bubbles were
still attached to the surface after the sample was taken out of the solution, as shown in