

22 Acoustic Emission Monitoring of Pitting Corrosion …
261
stage, the number and activity of the 2-channel are significantly higher than the 1channel. It indicates that the signal frequency band at this stage should be mainly
distributed in the low frequency range.
22.3.2 Signal Waveform Analysis
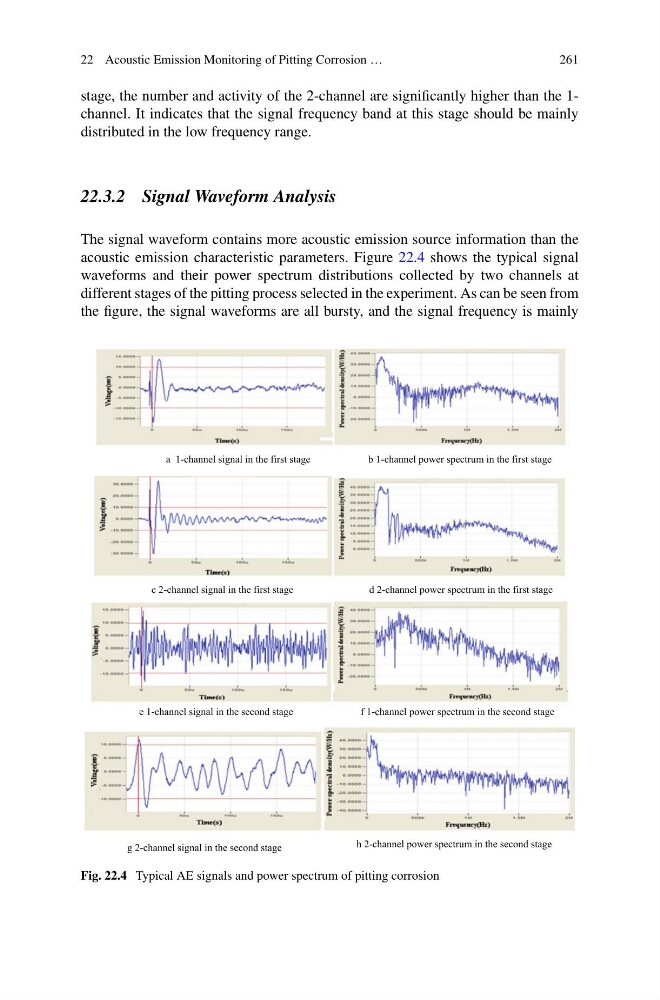
The signal waveform contains more acoustic emission source information than the
acoustic emission characteristic parameters. Figure 22.4 shows the typical signal
waveforms and their power spectrum distributions collected by two channels at
different stages of the pitting process selected in the experiment. As can be seen from
the figure, the signal waveforms are all bursty, and the signal frequency is mainly
Fig. 22.4 Typical AE signals and power spectrum of pitting corrosion
261
stage, the number and activity of the 2-channel are significantly higher than the 1channel. It indicates that the signal frequency band at this stage should be mainly
distributed in the low frequency range.
22.3.2 Signal Waveform Analysis
The signal waveform contains more acoustic emission source information than the
acoustic emission characteristic parameters. Figure 22.4 shows the typical signal
waveforms and their power spectrum distributions collected by two channels at
different stages of the pitting process selected in the experiment. As can be seen from
the figure, the signal waveforms are all bursty, and the signal frequency is mainly
Fig. 22.4 Typical AE signals and power spectrum of pitting corrosion