

21 High-Temperature Creep Damage Evolution of C/SiC …
241
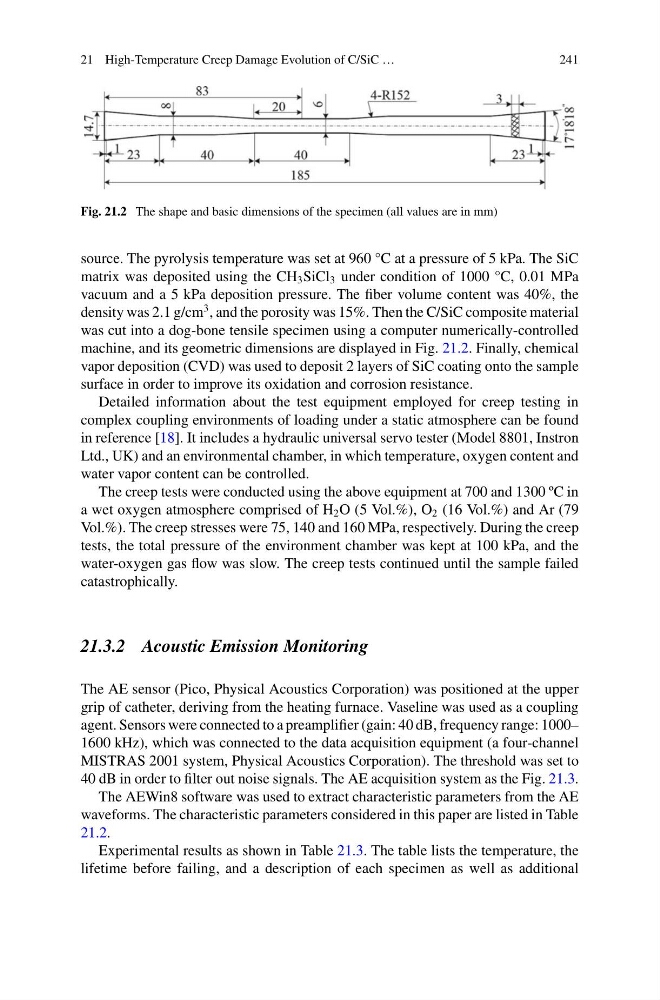
Fig. 21.2 The shape and basic dimensions of the specimen (all values are in mm)
source. The pyrolysis temperature was set at 960 °C at a pressure of 5 kPa. The SiC
matrix was deposited using the CH 3 SiCl 3 under condition of 1000 °C, 0.01 MPa
vacuum and a 5 kPa deposition pressure. The fiber volume content was 40%, the
density was 2.1 g/cm
3 , and the porosity was 15%. Then the C/SiC composite material
was cut into a dog-bone tensile specimen using a computer numerically-controlled
machine, and its geometric dimensions are displayed in Fig. 21.2. Finally, chemical
vapor deposition (CVD) was used to deposit 2 layers of SiC coating onto the sample
surface in order to improve its oxidation and corrosion resistance.
Detailed information about the test equipment employed for creep testing in
complex coupling environments of loading under a static atmosphere can be found
in reference [18]. It includes a hydraulic universal servo tester (Model 8801, Instron
Ltd., UK) and an environmental chamber, in which temperature, oxygen content and
water vapor content can be controlled.
The creep tests were conducted using the above equipment at 700 and 1300 ºC in
a wet oxygen atmosphere comprised of H 2 O (5 Vol.%), O 2 (16 Vol.%) and Ar (79
Vol.%). The creep stresses were 75, 140 and 160 MPa, respectively. During the creep
tests, the total pressure of the environment chamber was kept at 100 kPa, and the
water-oxygen gas flow was slow. The creep tests continued until the sample failed
catastrophically.
21.3.2 Acoustic Emission Monitoring
The AE sensor (Pico, Physical Acoustics Corporation) was positioned at the upper
grip of catheter, deriving from the heating furnace. Vaseline was used as a coupling
agent. Sensors were connected to a preamplifier (gain: 40 dB, frequency range: 1000–
1600 kHz), which was connected to the data acquisition equipment (a four-channel
MISTRAS 2001 system, Physical Acoustics Corporation). The threshold was set to
40 dB in order to filter out noise signals. The AE acquisition system as the Fig. 21.3.
The AEWin8 software was used to extract characteristic parameters from the AE
waveforms. The characteristic parameters considered in this paper are listed in Table
21.2.
Experimental results as shown in Table 21.3. The table lists the temperature, the
lifetime before failing, and a description of each specimen as well as additional
241
Fig. 21.2 The shape and basic dimensions of the specimen (all values are in mm)
source. The pyrolysis temperature was set at 960 °C at a pressure of 5 kPa. The SiC
matrix was deposited using the CH 3 SiCl 3 under condition of 1000 °C, 0.01 MPa
vacuum and a 5 kPa deposition pressure. The fiber volume content was 40%, the
density was 2.1 g/cm
3 , and the porosity was 15%. Then the C/SiC composite material
was cut into a dog-bone tensile specimen using a computer numerically-controlled
machine, and its geometric dimensions are displayed in Fig. 21.2. Finally, chemical
vapor deposition (CVD) was used to deposit 2 layers of SiC coating onto the sample
surface in order to improve its oxidation and corrosion resistance.
Detailed information about the test equipment employed for creep testing in
complex coupling environments of loading under a static atmosphere can be found
in reference [18]. It includes a hydraulic universal servo tester (Model 8801, Instron
Ltd., UK) and an environmental chamber, in which temperature, oxygen content and
water vapor content can be controlled.
The creep tests were conducted using the above equipment at 700 and 1300 ºC in
a wet oxygen atmosphere comprised of H 2 O (5 Vol.%), O 2 (16 Vol.%) and Ar (79
Vol.%). The creep stresses were 75, 140 and 160 MPa, respectively. During the creep
tests, the total pressure of the environment chamber was kept at 100 kPa, and the
water-oxygen gas flow was slow. The creep tests continued until the sample failed
catastrophically.
21.3.2 Acoustic Emission Monitoring
The AE sensor (Pico, Physical Acoustics Corporation) was positioned at the upper
grip of catheter, deriving from the heating furnace. Vaseline was used as a coupling
agent. Sensors were connected to a preamplifier (gain: 40 dB, frequency range: 1000–
1600 kHz), which was connected to the data acquisition equipment (a four-channel
MISTRAS 2001 system, Physical Acoustics Corporation). The threshold was set to
40 dB in order to filter out noise signals. The AE acquisition system as the Fig. 21.3.
The AEWin8 software was used to extract characteristic parameters from the AE
waveforms. The characteristic parameters considered in this paper are listed in Table
21.2.
Experimental results as shown in Table 21.3. The table lists the temperature, the
lifetime before failing, and a description of each specimen as well as additional